11
OUR GROWTH STRATEGY
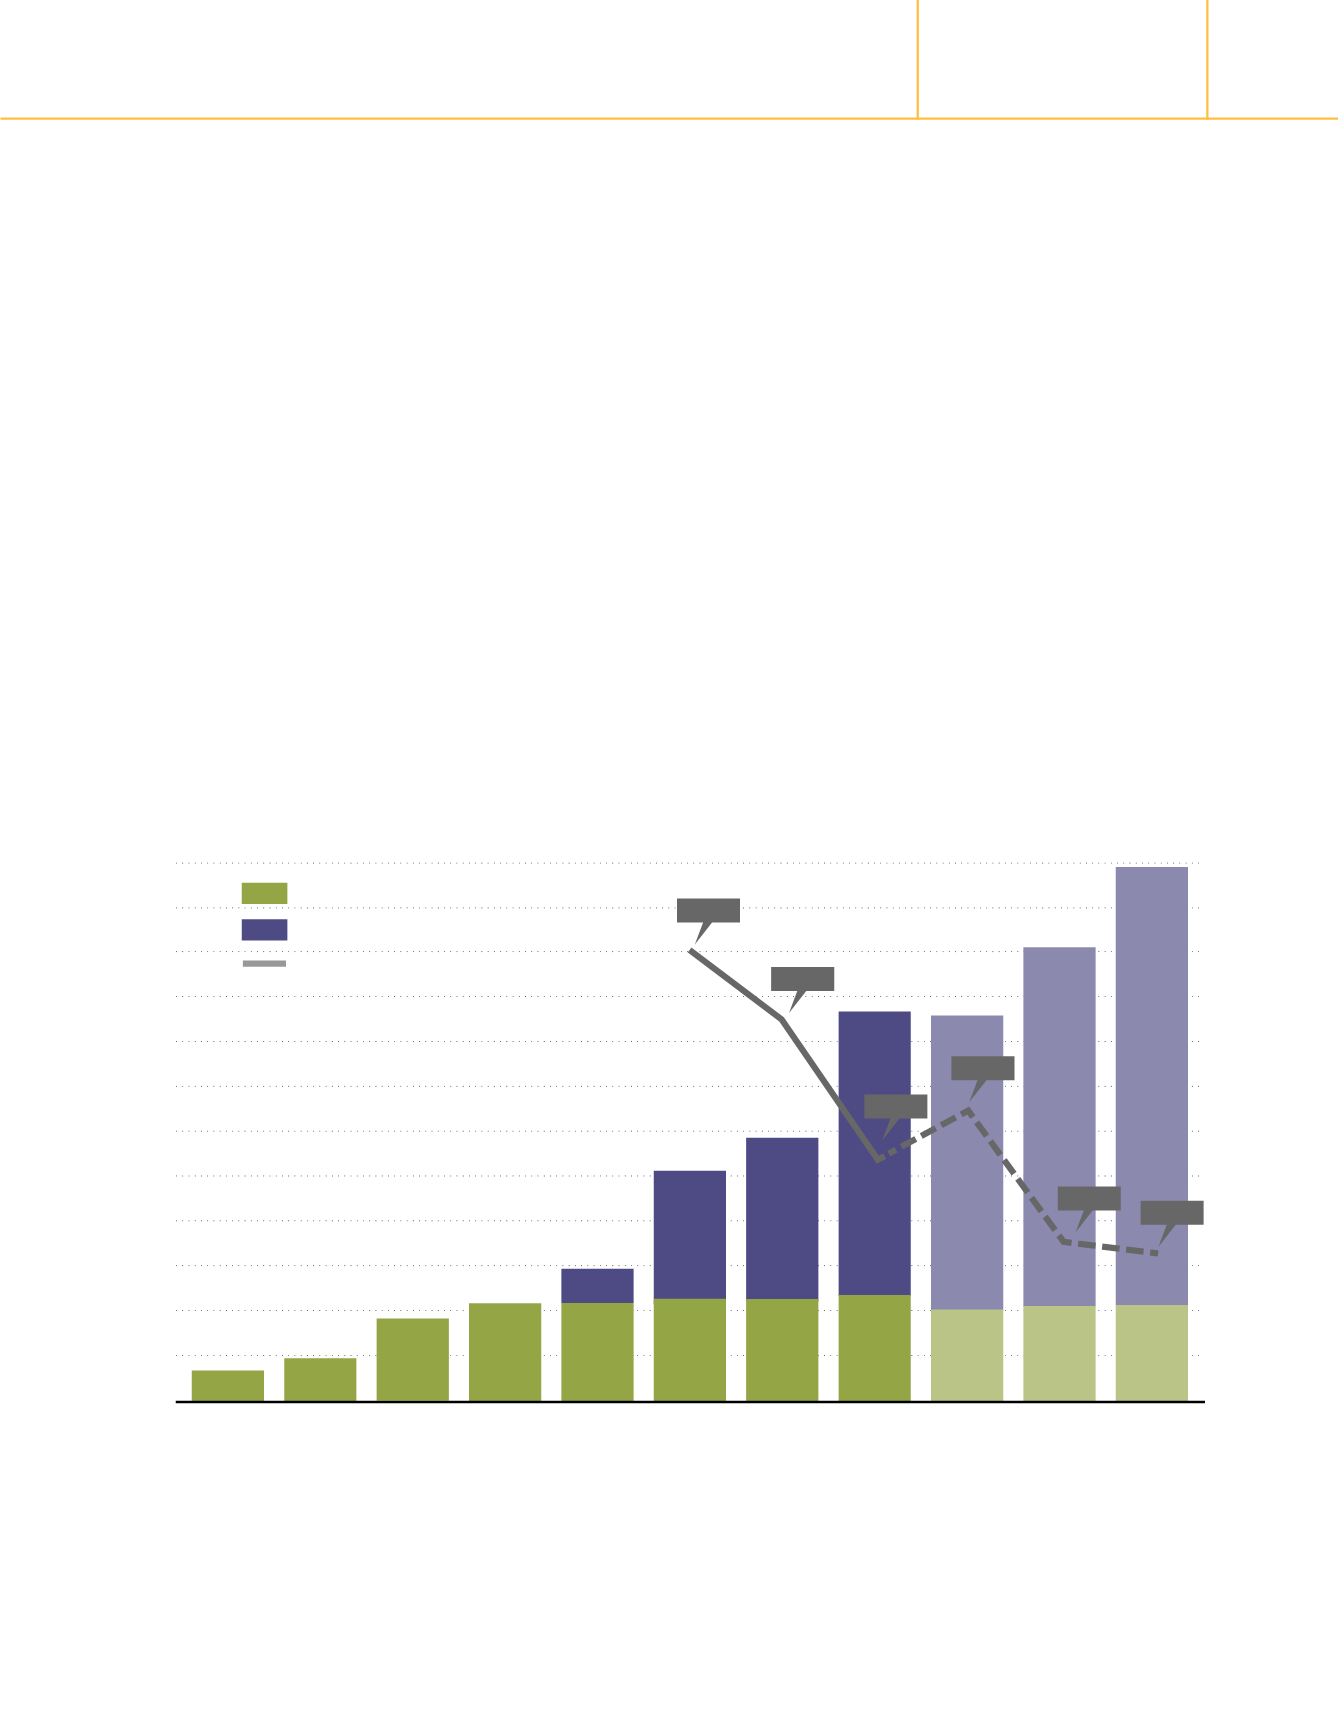
DRIVING GROWTH FROM WITHIN
0.6
2007 2008 2009 2010 2011 2012 2013 2014
2015E 2016E 2017E
Caylloma Mine, Peru
San Jose Mine, Mexico
AISCC ($/oz Ag)
*
Ag Eq (Moz)
0.9
1.9
10
12
8
6
4
2
0
2.1
2.1
0.8
3.0
3.6
6.4
2.2
2.2
2.3
6.6
8.0
9.8
2.0
2.1
2.1
23.02
20.45
14.48
16.61
10.93
10.22
1. 2015-2017E AISCC estimated using Au = $1,200/oz Au, Pb = $2,000/t, Zn = $2,200/t; 2015E AISCC includes brownfields
exploration, however, brownfields exploration is not included in 2016E and 2017E
2. Ag Eq calculated using silver to gold ratio of 60 to 1
Driving low-risk, low-cost growth since 2005
Our primary strategy is to drive low-risk, low-cost organic growth by exploring and developing the 98,000
hectares surrounding our mines in Peru and Mexico. We have followed this disciplined approach since Fortuna
was established in 2005. By 2014, we had steadily increased production to 8.7 million silver equivalent ounces,
while also reducing production costs.
Our highly prospective land portfolio remains the foundation of our growth. We expect annual production to
reach approximately 12 million silver equivalent ounces by 2017 on completion of our most recent mill
expansion at the San Jose Mine in Mexico.
To further drive growth, we are also seeking opportunities to acquire silver-gold rich properties in other mining-
friendly areas of the Americas. Our favored targets are those that will provide low-cost production with minimal
technical and financial risk.
Increasing silver equivalent production and reducing costs


