4
FORTUNA SILVER MINES INC. | 2014 ANNUAL REPORT
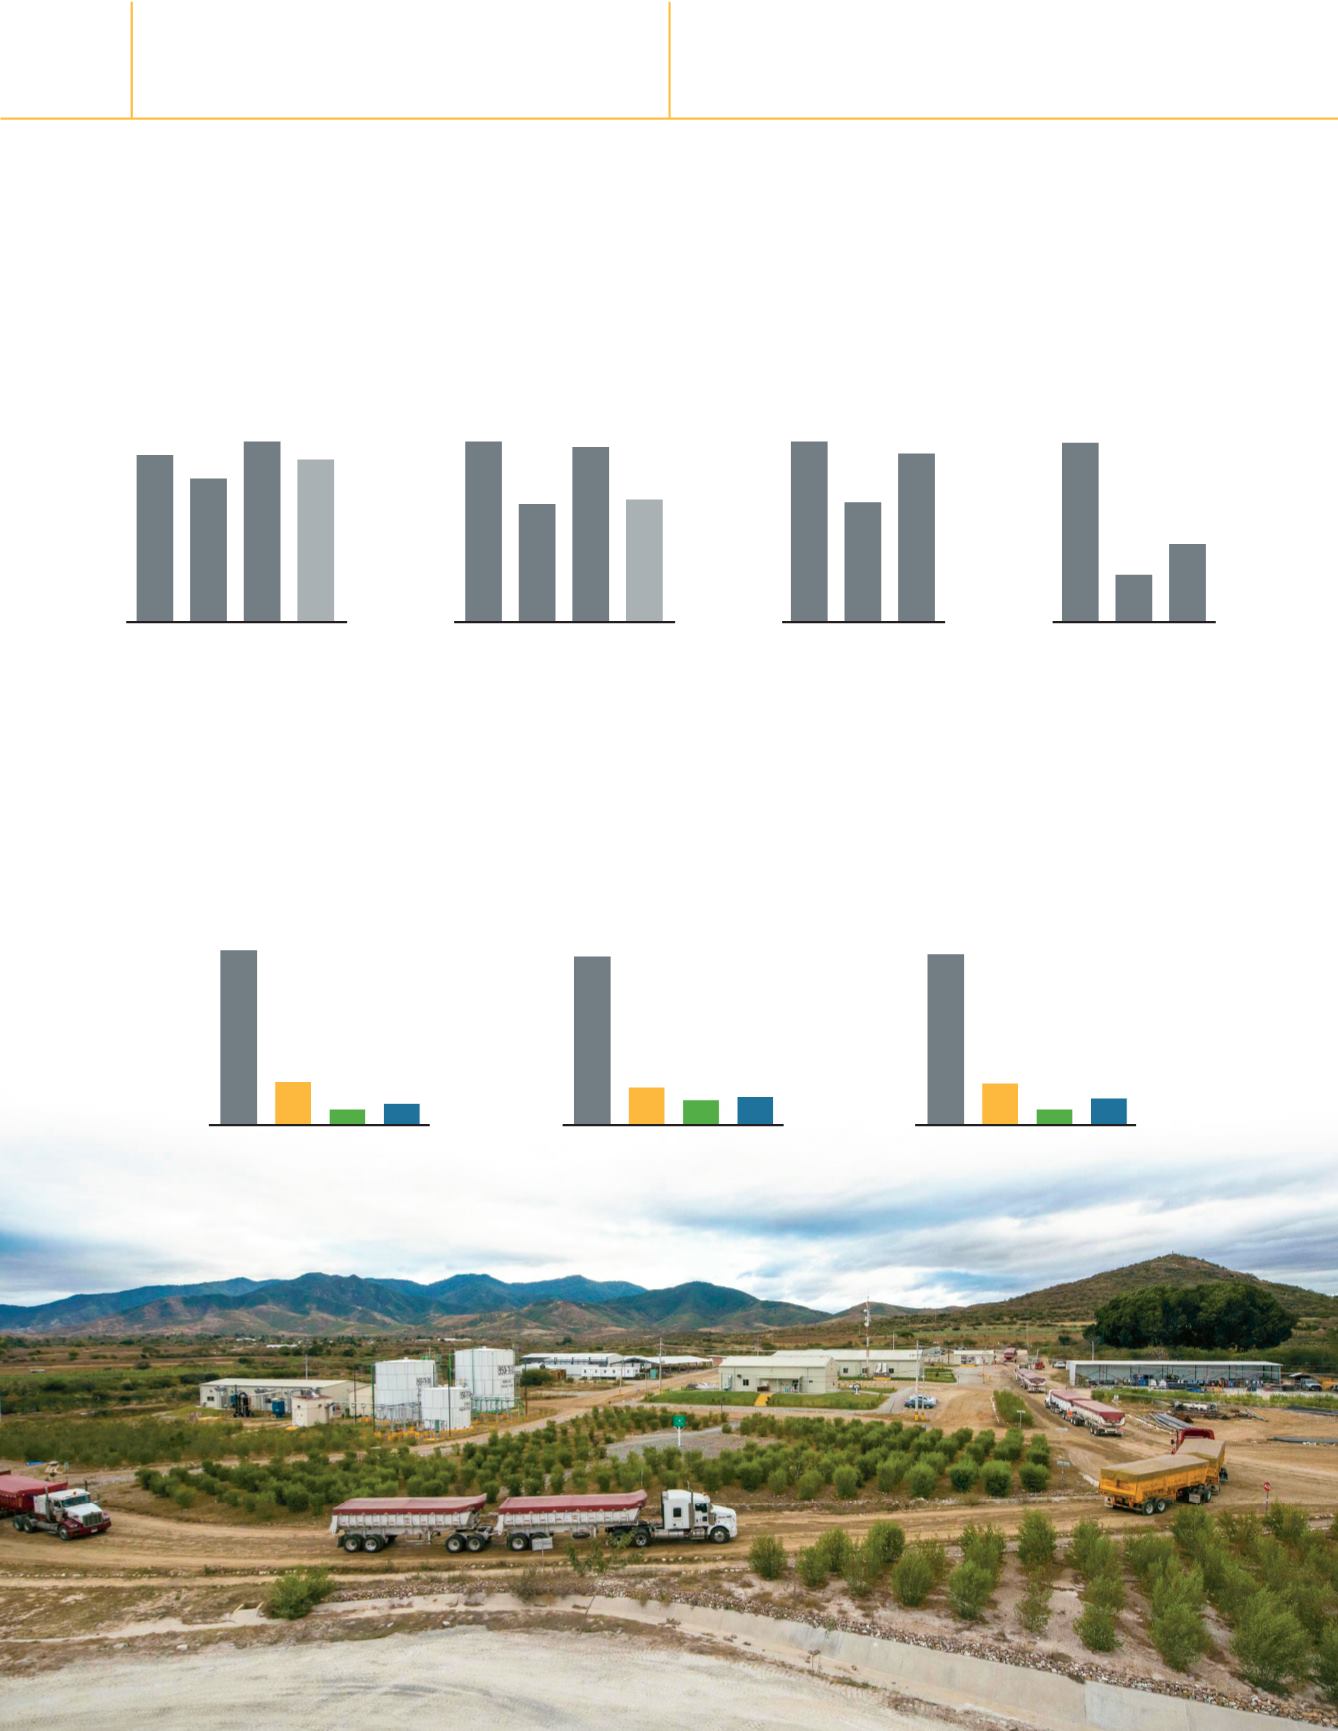
2012
9% 7%
Silver Gold Lead Zinc
17%
67%
2013
11%
10%
Silver Gold Lead Zinc
14%
65%
2014
11%
7%
Silver Gold Lead Zinc
16%
66%
Sales by Metal
Revenue
($ million)
Cash Flow
from Operations
($ million)
Cash Flow
per Share
($)
Adjusted Earnings
per Share
**
($)
2014 Highlights
62.2
59.8
40.9
42.1
2012 2013 2014
2015E
*
174.0
156.4
137.4
161.0
2012 2013 2014
2015E
*
0.50
2012 2013 2014
0.47
0.33
2012 2013 2014
0.28
0.12
0.07
* 2015E: Au = $1,207/oz, Ag = $16.40/oz, Pb = $1,923/t and Zn = $2,176/t
** Net of tax
Disciplined str egy drives growth in earnings, production and reserves
Concentrate transport at San Jose Mine, Mexico


