Fortuna reports record production and financial results for the third quarter of 2023
November 8, 2023 02:00 AM PST
(All amounts are expressed in US dollars, tabular amounts in millions, unless otherwise stated)
Vancouver, November 8, 2023: Fortuna Silver Mines Inc. (NYSE: FSM) (TSX: FVI) (“Fortuna” or the “Company”) today reported its financial and operating results for the third quarter of 2023.
Third Quarter 2023 highlights
Financial
- Net income4 of $27.5 million or $0.09 per share, compared to $3.1 million or $0.01 per share in Q2 2023
- Adjusted net income4,1 of $29.6 million or $0.10 per share, compared to $2.5 million or $0.01 per share in Q2 2023
- Adjusted EBITDA1 of $104.6 million, compared to $44.4 million in Q2 2023
- Net cash provided by operating activities of $106.5 million and free cash flow from ongoing operations1 of $70.0 million, compared to $44.2 million and $9.5 million, respectively, in Q2 2023
- Company paid down $40.0 million of its revolving credit facility. At the close of the quarter total net debt was $133.4 million and the total net debt to adjusted EBITDA ratio1 was 0.5
- Liquidity as of September 30, 2023 was $162.3 million5, compared to $97.9 million at the end of Q2 2023
Operational
- Gold production of 94,821 ounces, compared to 64,348 ounces in Q2 2023
- Silver production of 1,680,751 ounces, compared to 1,262,561 ounces in Q2 2023
- Gold equivalent6 production of 128,671 ounces, compared to 93,454 ounces in Q2 2023
- Consolidated cash costs1 per ounce of gold equivalent sold of $814, compared to $968 in Q2 2023
- Consolidated all-in sustaining costs (AISC)1 per ounce of gold equivalent sold of $1,312, compared to $1,799 in Q2 2023
- Year to date Lost Time Injury Frequency Rate (LTIFR) of 0.38 and Total Recordable Injury Frequency Rate (TRIFR) of 0.86.
Growth and Development
- The third quarter was the first full reporting period for the Séguéla Mine
- The acquisition of Chesser Resources Limited and its Diamba Sud project was completed on September 20, 2023 (Refer to the News Release dated September 20, 2023).
4 Attributable to Fortuna Shareholders
5 Excluding letters of credit
6 Au Eq includes gold, silver, lead and zinc and is calculated using the following metal prices: $1,924/oz Au, $23.70/oz Ag, $2,136/t Pb and $2,428/t Zn or Au:Ag = 1:81.19, Au:Pb = 1:0.90, Au:Zn = 0.79 for Q3 2023, and the following metal prices: $1,975/oz Au, $24.10/oz Ag, $0.96/t Pb and $1.23/t Zn or Au:Ag = 1:81.96, Au:Pb = 1:0.93, Au:Zn = 1:0.73 for Q2 2023.
Jorge A. Ganoza, President and CEO, commented, “Fortuna has delivered record production and financial results for all its key metrics driven by the first full quarter contribution of our flagship Séguéla gold mine.” Mr. Ganoza continued, “Compared to the first half of the year, the reduction in our consolidated all-in sustaining cost to $1,312 is primarily the result of Séguéla’s industry leading AISC of $788 per ounce, abating inflation, optimization initiatives across the business, and higher gold production at the Yaramoko mine driven by new high grade zones.” Mr. Ganoza concluded, “As we shift from a two-year capital-intensive phase to strong free cash flow generation, we will prioritize strengthening our balance sheet through debt reduction and advancing high value opportunities in our exploration portfolio. We currently maintain eleven drill rigs turning across our properties including three at our newly acquired Diamba Sud gold project in Senegal.”
Third Quarter 2023 Consolidated Results
1 Refer to Non-IFRS Financial Measures section at the end of this news release and to the MD&A accompanying the Company’s financial statements filed on SEDAR+ at www.sedarplus.ca for a description of the calculation of these measures.
2 Capital expenditures are presented on a cash basis
3 Non-sustaining expenditures include greenfields exploration
Figures may not add due to rounding
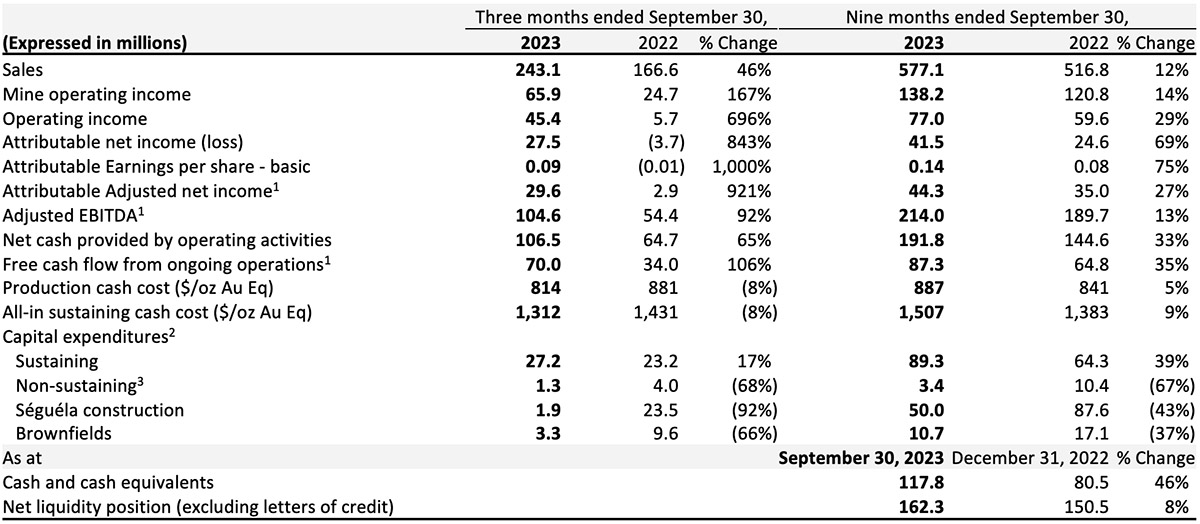
Third Quarter 2023 Results
Net income attributable to Fortuna for the quarter was $27.5 million compared to an attributable net loss of $3.7 million in Q3 2022. After adjusting for non-cash and non-recurring items, adjusted attributable net income for the quarter was $29.6 million compared to $2.9 million in Q3 2022. The increase in net income and adjusted net income is explained mainly by increased gold sales volume, higher realized gold and silver prices and lower cost of sales per gold equivalent ounce. Higher gold sales volume was primarily due to the contribution from the first quarter of commercial production at Séguéla and higher grades at Yaramoko. This was partially offset by lower gold sales volume at Lindero related to lower grades, in line with the mine plan. The realized gold and silver prices were $1,925 and $23.7 per ounce, respectively, in Q3 2023 compared to $1,718 and $19.2 per ounce, respectively, in the prior year. The lower cash cost of sales per gold equivalent ounce was mainly due to the contribution of low-cost production from Séguéla and lower cost of sales per ounce of gold at Yaramoko related to higher grades. This was partially offset by higher costs of sales per ounce at Lindero and San Jose. Other items impacting net income in the quarter were higher interest expenses of $5.7 million as a result of interest costs no longer being capitalized in the quarter, higher outstanding debt and increased interest rates; lower depletion at Séguéla which is expected to increase in the coming quarters from depletion of the purchase price; and a low effective income tax rate in the quarter of 17.6% as no income taxes were recorded at Séguéla.
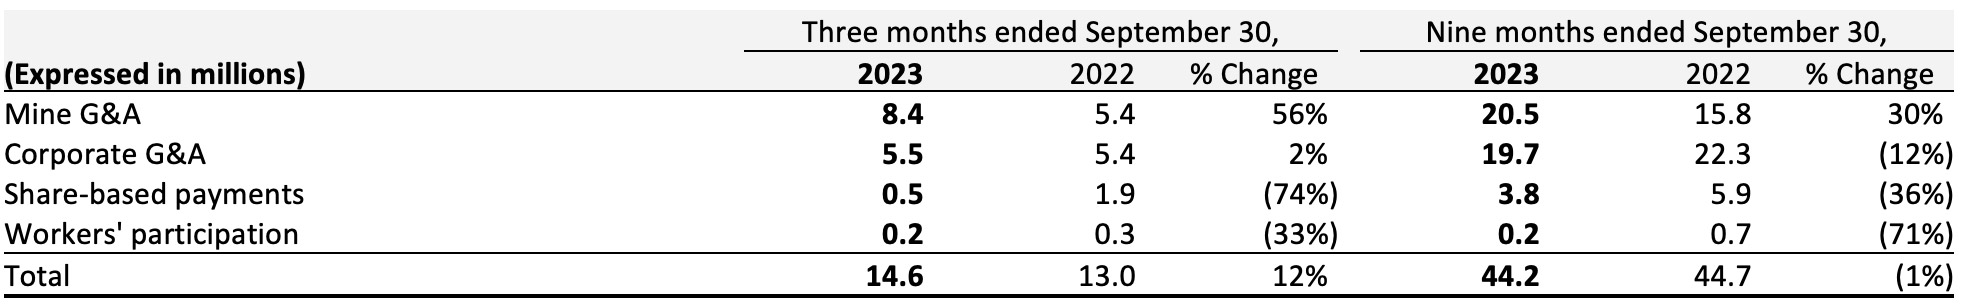
General and administrative expenses for the quarter of $14.6 million were higher than the same period in 2022 as Séguéla transitioned to operations and costs are no longer being capitalized. G&A is comprised of the following items:
Net cash generated by operations for the quarter increased $41.6 to $106.5 million. The increase reflects higher EBITDA of $51.2 million offset by lower changes in working capital in Q3 2023 of $0.2 million compared to a change in Q3 2022 of $11.5 million. Income tax paid in the quarter of $3.2 million was $5.6 million lower than in Q3 2022 as no income tax was paid at Séguéla in Q3 2023. It is expected Séguéla will start incurring current income taxes in Q4 2023 and paying income taxes in 2024.
In the third quarter of 2023 capital expenditures on a cash basis was $37.0 million consisting primarily of $30.6 million in sustaining capital, including brownfields exploration, and $4.0 million of non-sustaining exploration.
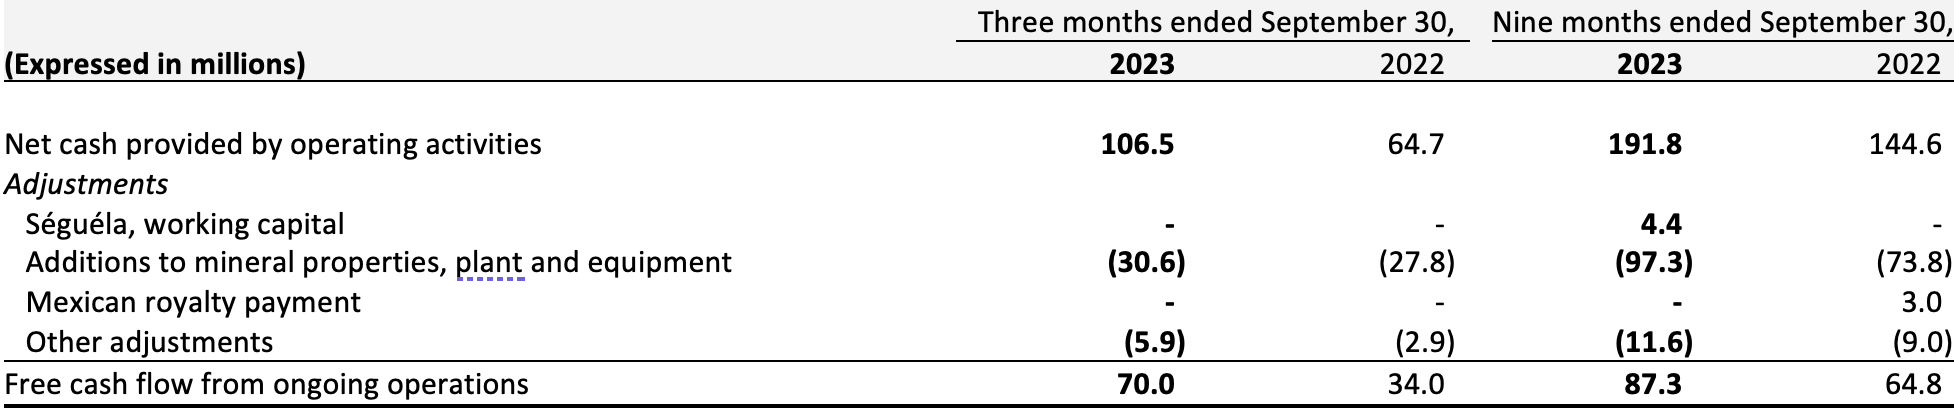
Free cash flow from ongoing operations for the quarter was $70.0 million, compared to $34.0 million in Q3 2022. The increase of $36.0 million is the result of higher net cash generated by operations of $41.8 million partially offset by higher sustaining capex and brownfields exploration at our operating mines of $5.8 million in Q3 2023.
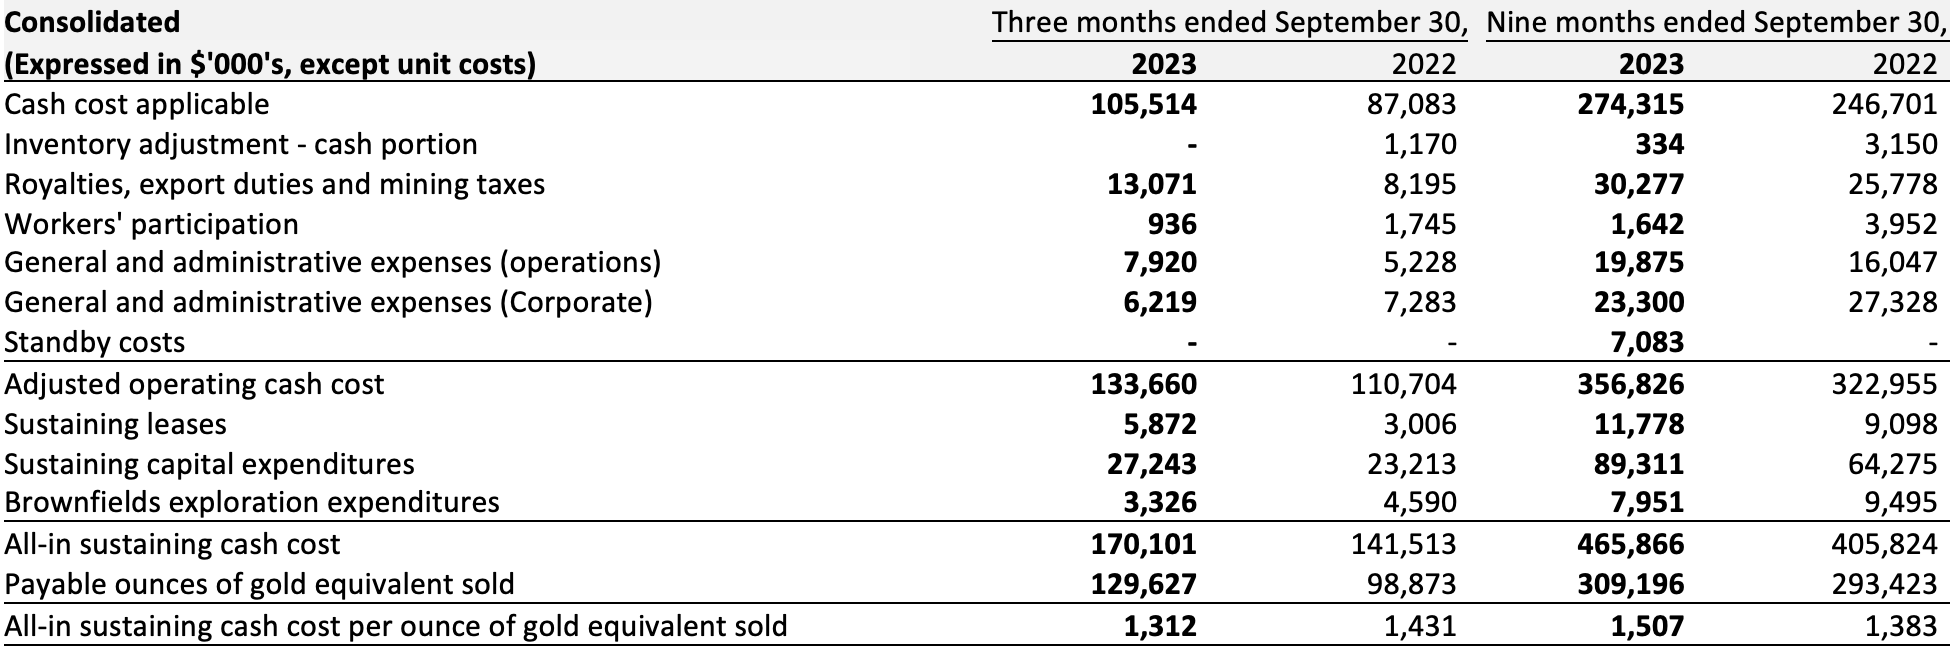
Consolidated All-in Sustaining Cost
Consolidated AISC per gold equivalent ounce (GEO) sold for the third quarter of 2023 was $1,312 per ounce compared to $1,431 per ounce for the comparable quarter in 2022. The lower AISC was driven by a decrease of $67 in cash cost of sales per gold equivalent ounce to $814 and lower capital costs per ounce driven by higher volume.
Liquidity
The Company’s total liquidity available as of September 30, 2023 was $162.3 million comprised of $117.8 million in cash and cash equivalents, and $44.5 million undrawn on the $250.0 million revolving credit facility (excluding letters of credit).
Lindero Mine, Argentina
1 Cash cost and All-in sustaining cash cost are non-IFRS financial measures; refer to non-IFRS financial measures section at the end of this news release and to the MD&A accompanying the Company’s financial statements filed on SEDAR+ at www.sedarplus.ca for a description of the calculation of these measures.
2 Capital expenditures are presented on a cash basis.
Quarterly Operating and Financial Highlights
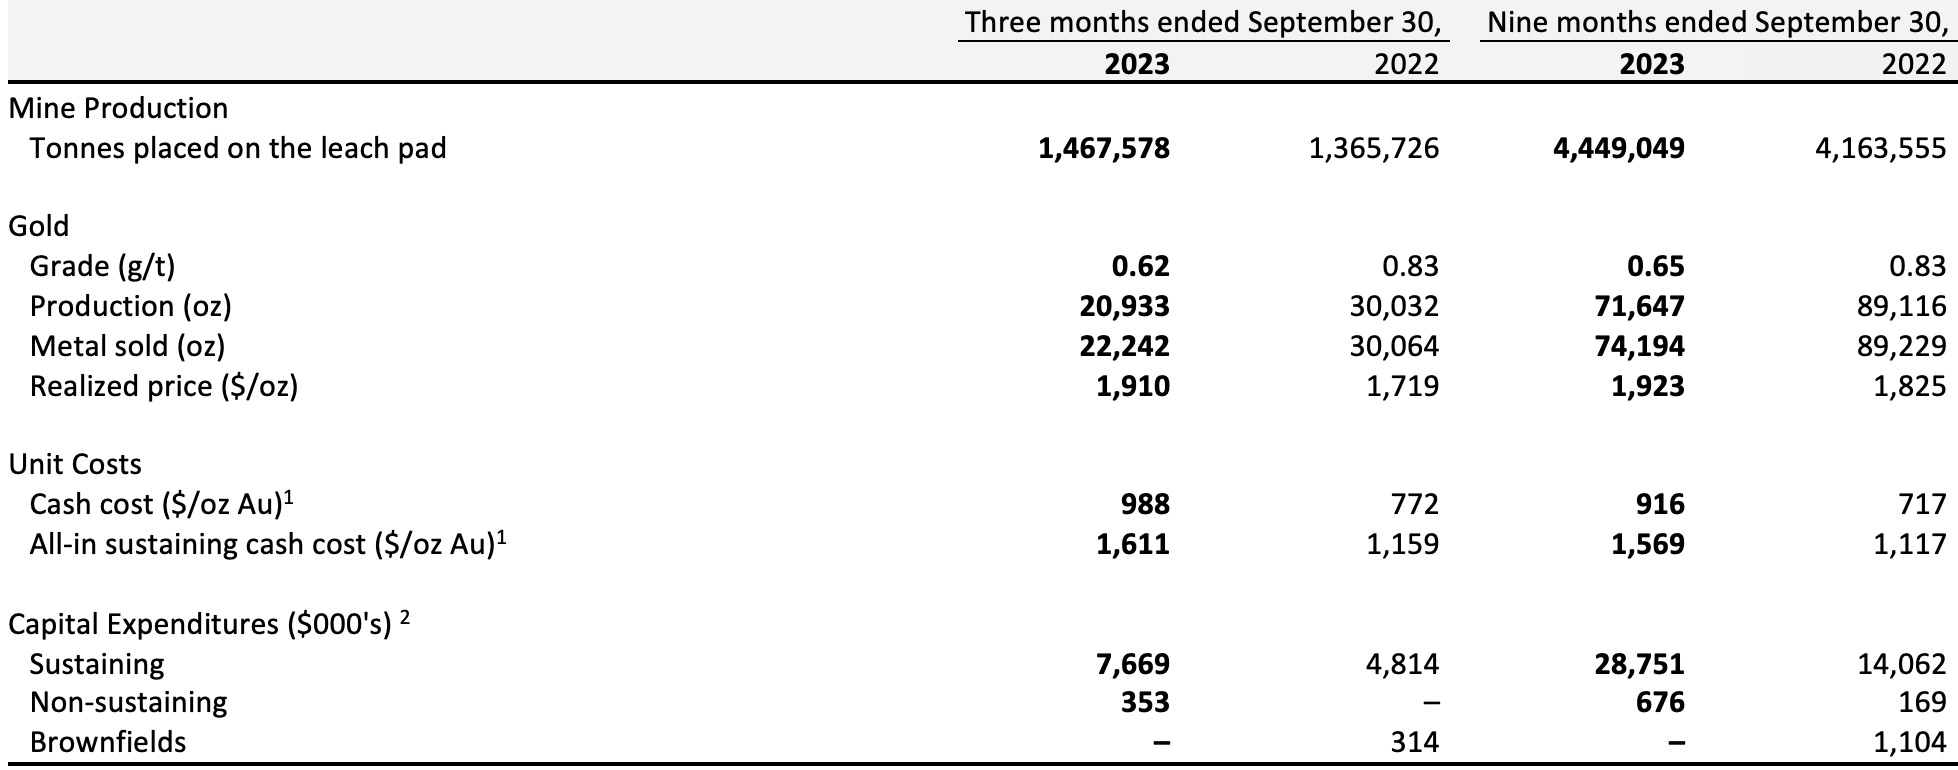
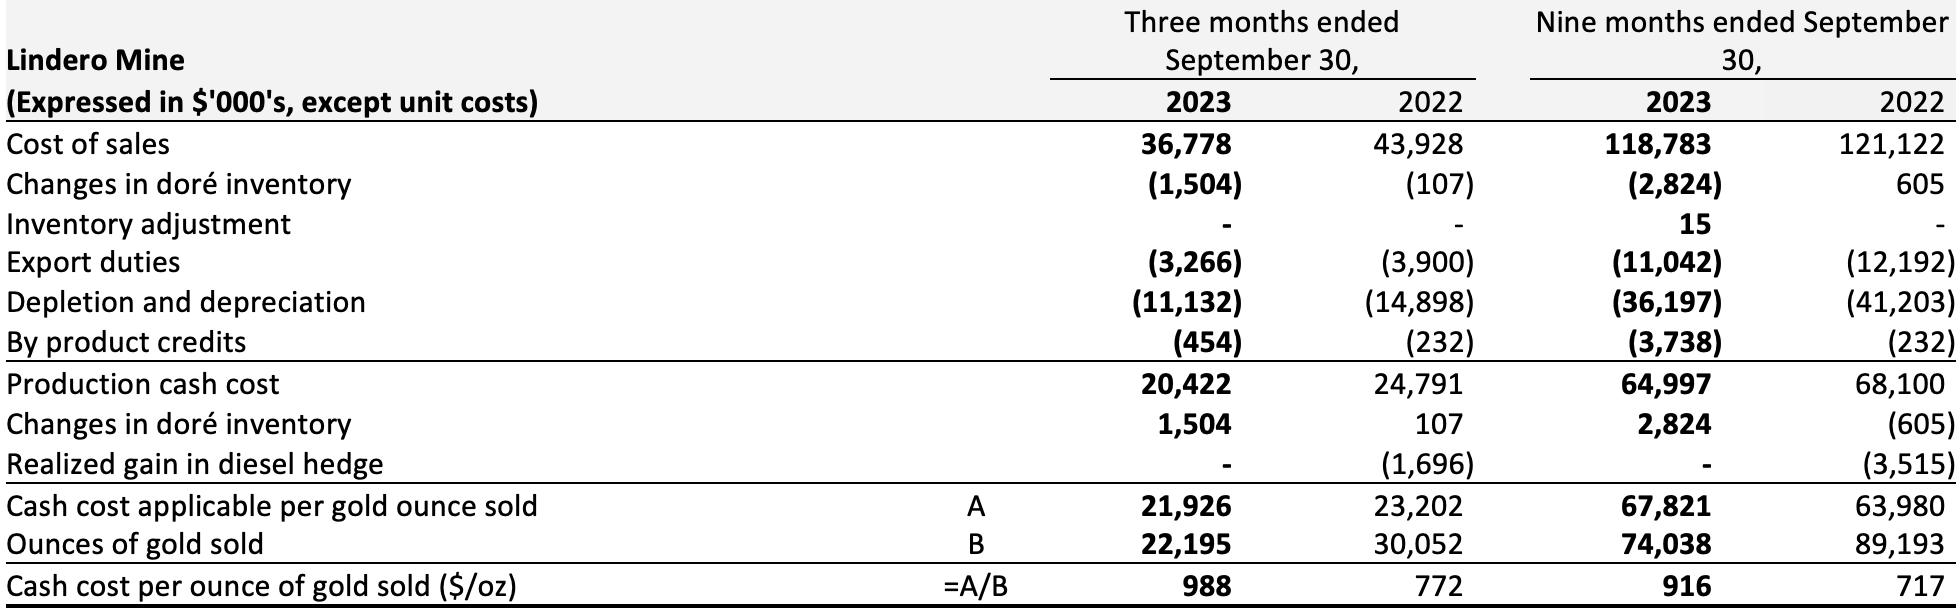
In the third quarter of 2023, a total of 1,467,578 tonnes of ore were placed on the heap leach pad, with an average gold grade of 0.62 g/t, containing an estimated 29,068 ounces of gold. Gold production for Q3 2023 totaled 20,933 ounces. This represents a 30% decrease in total ounces to the comparable quarter of 2022. This decline in gold production can be primarily explained by the lower head grade of ore placed on the leach pad, in accordance with the mining sequence and the Mineral Reserves. Ore mined was 1.9 million tonnes, with a stripping ratio of 1.1:1. The stripping ratio in the third quarter is 59 percent lower than the second quarter and is expected to continue declining through to the end of the year.
Higher stripping of waste in the first nine months of the year will allow improved access to higher grade material scheduled in the mine plan for the fourth quarter. As a result, Lindero anticipates placing approximately 1.6 million tonnes of ore on the leach pad in Q4 2023 at a higher average grade of 0.67 g/t Au.
Cash cost per ounce of gold for the quarter ended September 30, 2023, was $988 compared to $772 in the same period in 2022. Cash cost per ounce of gold was higher due to lower head grades in line with the mine plan, partially offset by lower processing costs.
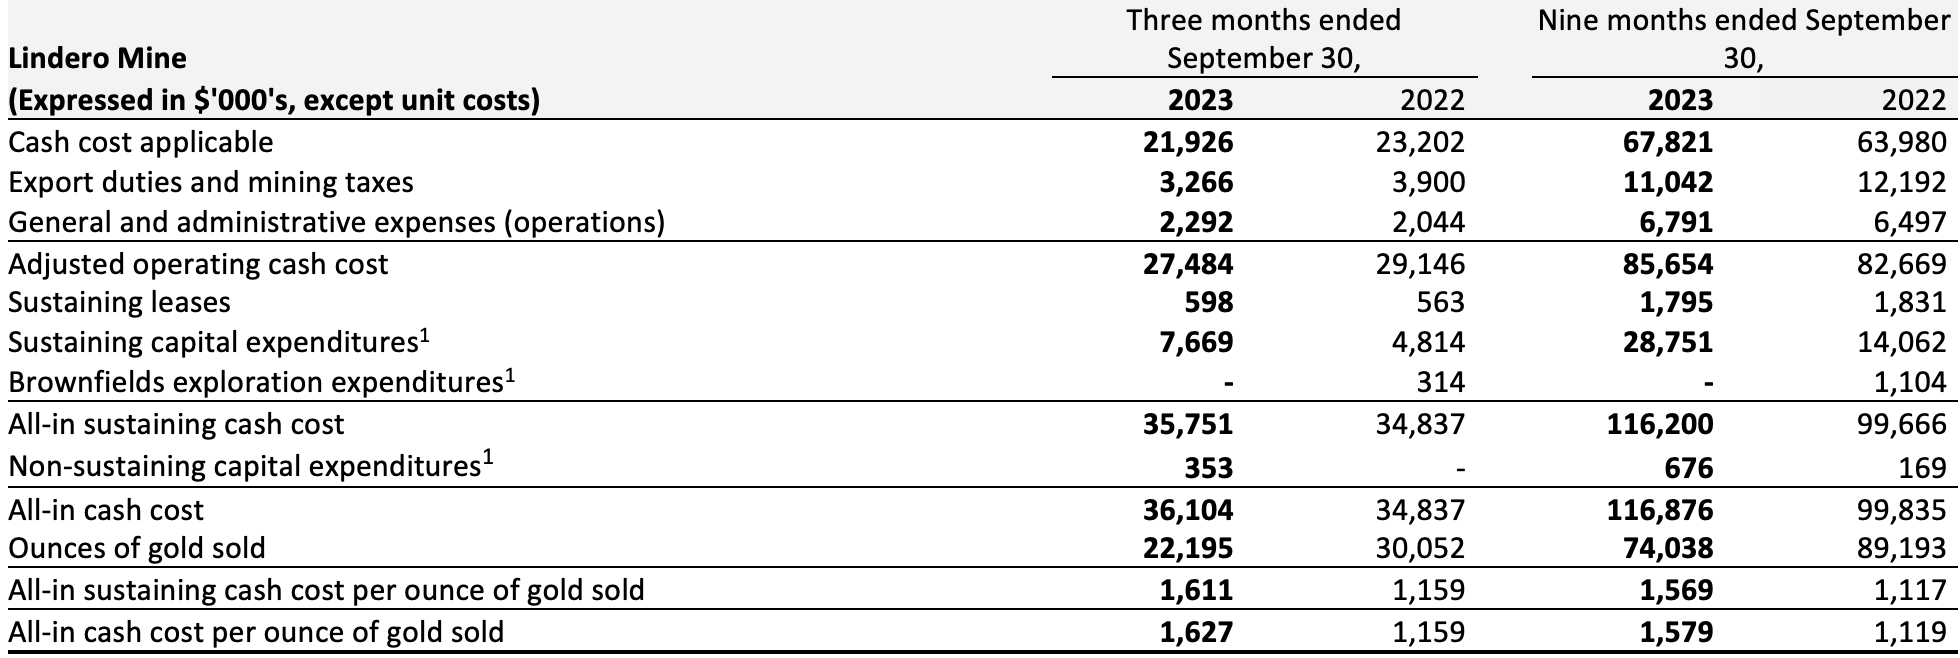
All-in sustaining cash cost per gold ounce sold was $1,611 during Q3 2023 compared with $1,159 in the same period of 2022. All-in sustaining cash cost for the third quarter of 2023 was impacted by lower production described above and higher sustaining capital expenditures.
During the quarter, increased sustaining capital expenditures were primarily driven by the development of Phase 2 of the leach pad and capitalized stripping. As of September 30, 2023, the leach pad expansion project (Project) is approximately 13 percent complete. The procurement construction and management (PCM) service has been awarded to Knight Piésold, the accommodation camp expansion and PCM offices for the Project have been finalized, and PCM personnel are already onsite. Mobilization of the contractor’s personnel and equipment has commenced. The first shipments of geomembrane and geosynthetic clay liner are in transit, and the Project remains on schedule for completion during the second half of 2024.
Yaramoko Mine Complex, Burkina Faso
1 Cash cost and All-in sustaining cash cost are non-IFRS financial measures; refer to non-IFRS financial measures section at the end of this news release and to the MD&A accompanying the Company’s financial statements filed on SEDAR+ at www.sedarplus.ca for a description of the calculation of these measures.
2 Capital expenditures are presented on a cash basis.
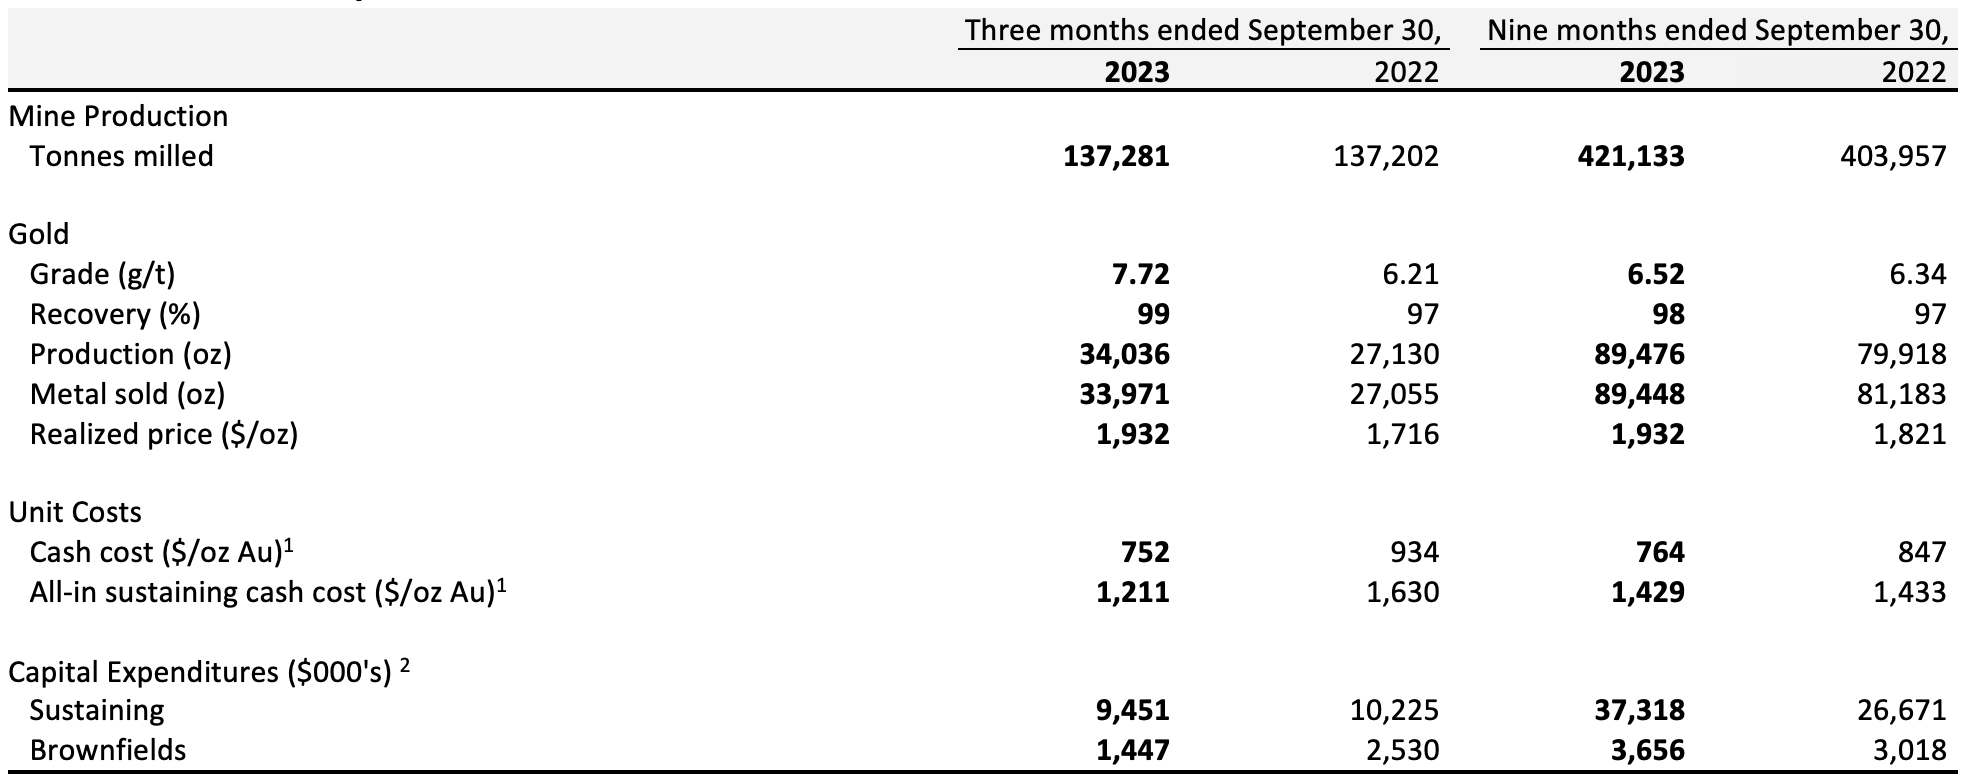
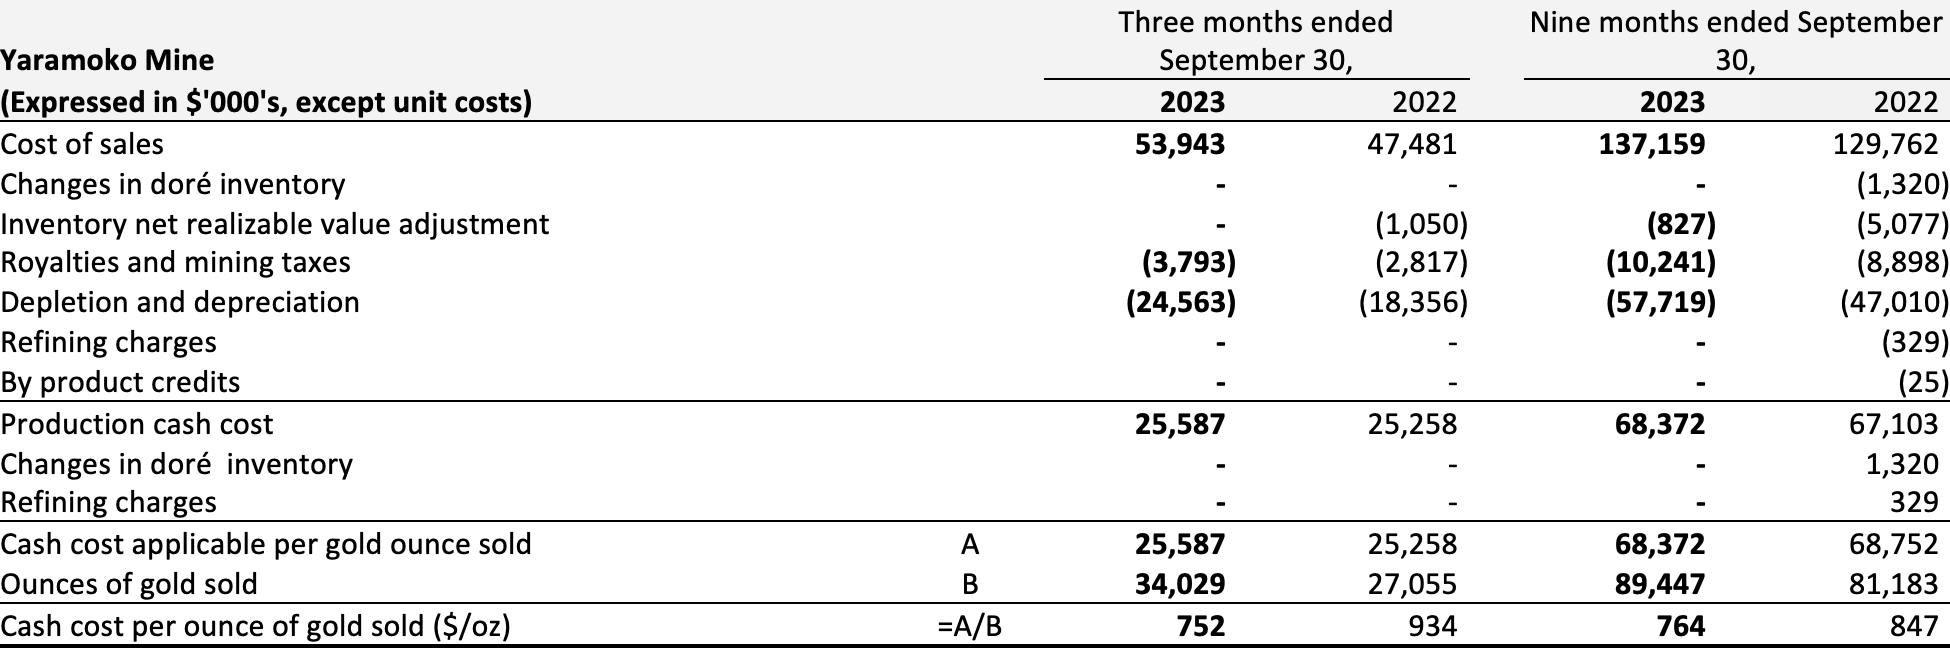
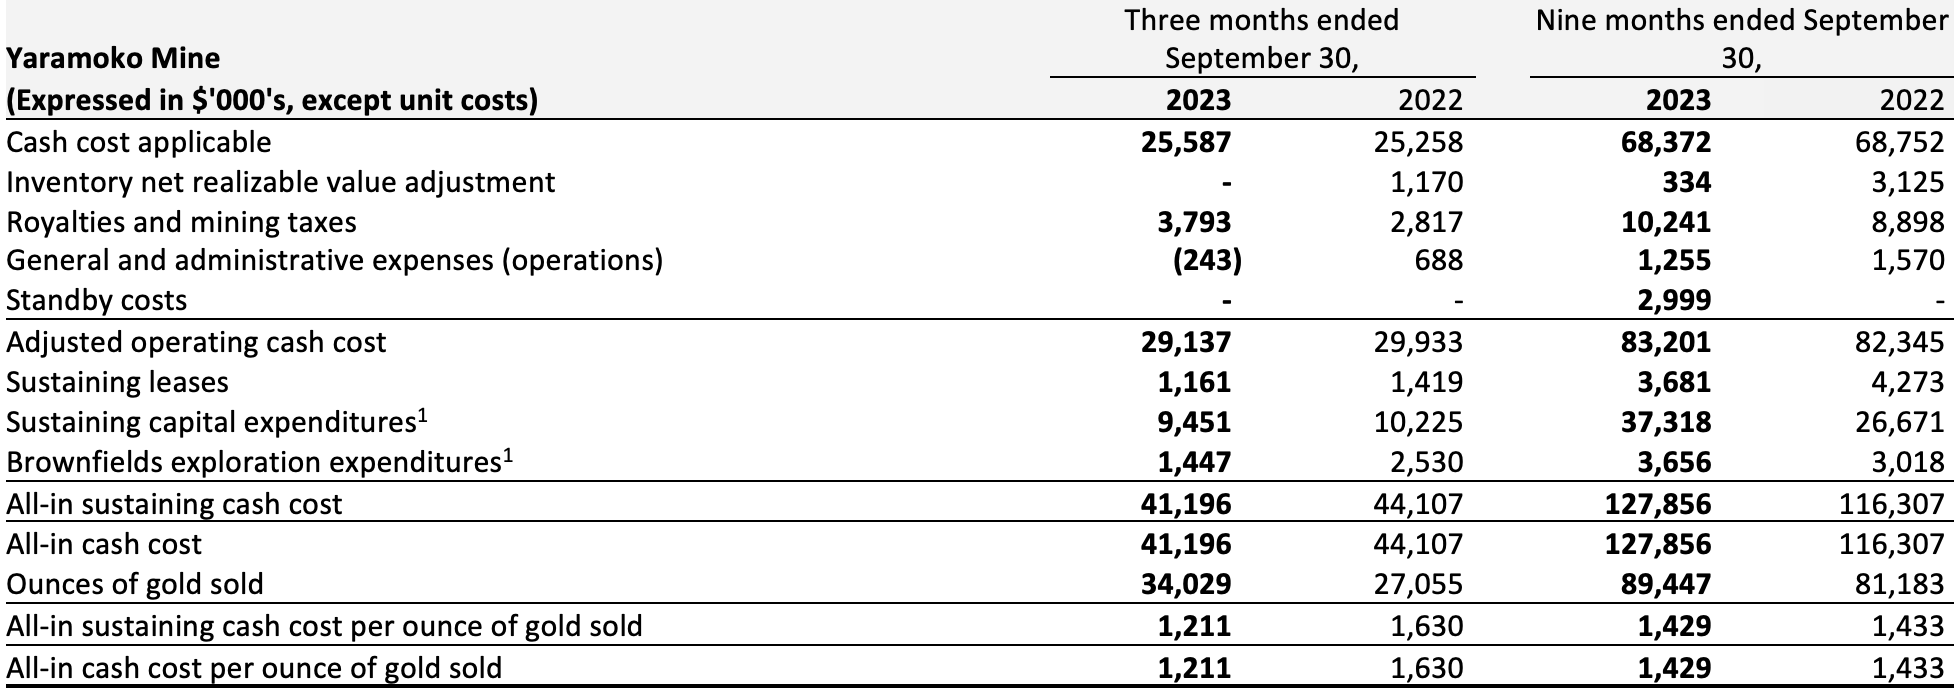
The Yaramoko Mine produced 34,036 ounces of gold in the third quarter of 2023 with an average gold head grade of 7.72g/t, 25% and 24% increases when compared to the same period in 2022. Increased production resulted from higher average grades and greater widths of mineralization encountered in development headings, which contributed 42% of total mill feed.
As a result of the aforementioned higher grades in development and production zones within the mine plan, the Company has revised Yaramoko’s annual gold production guidance upwards to 110 to 120 thousand ounces from the original guidance of 92 to 102 thousand ounces, an increase of approximately 14 percent. Gold production for the first nine months of 2023 totaled 89,476 ounces.
Cash cost per ounce of gold sold for the quarter ended September 30, 2023, was $752 compared to $934 in the same period in 2022. Cash cost per ounce decreased due to higher production, improved head grades of ore processed, reduced mining costs related to ore development and decreased transportation costs.
All-in sustaining cash cost per gold ounce sold was $1,211 for Q3 2023, compared to $1,630 for the same period in 2022. This decrease was as a result of higher production, and cash cost savings described above.
Sustaining capital for Q3 2023 was higher due to more intensive mine development. Brownfields expenditure was primarily related to diamond drilling. Drilling focused on infill grade control and exploring for extensions beyond the mineralized resource envelope in the deeper eastern portion of Zone 55. During the fourth quarter, drilling will continue on the western portion of Zone 55, testing for up and down-dip continuity of the recently discovered extensions to the resource boundary.
Séguéla Mine, Côte d’Ivoire
1 Cash cost and All-in sustaining cash cost are non-IFRS financial measures. Refer to Non-IFRS Financial Measures.
2 Capital expenditures are presented on a cash basis
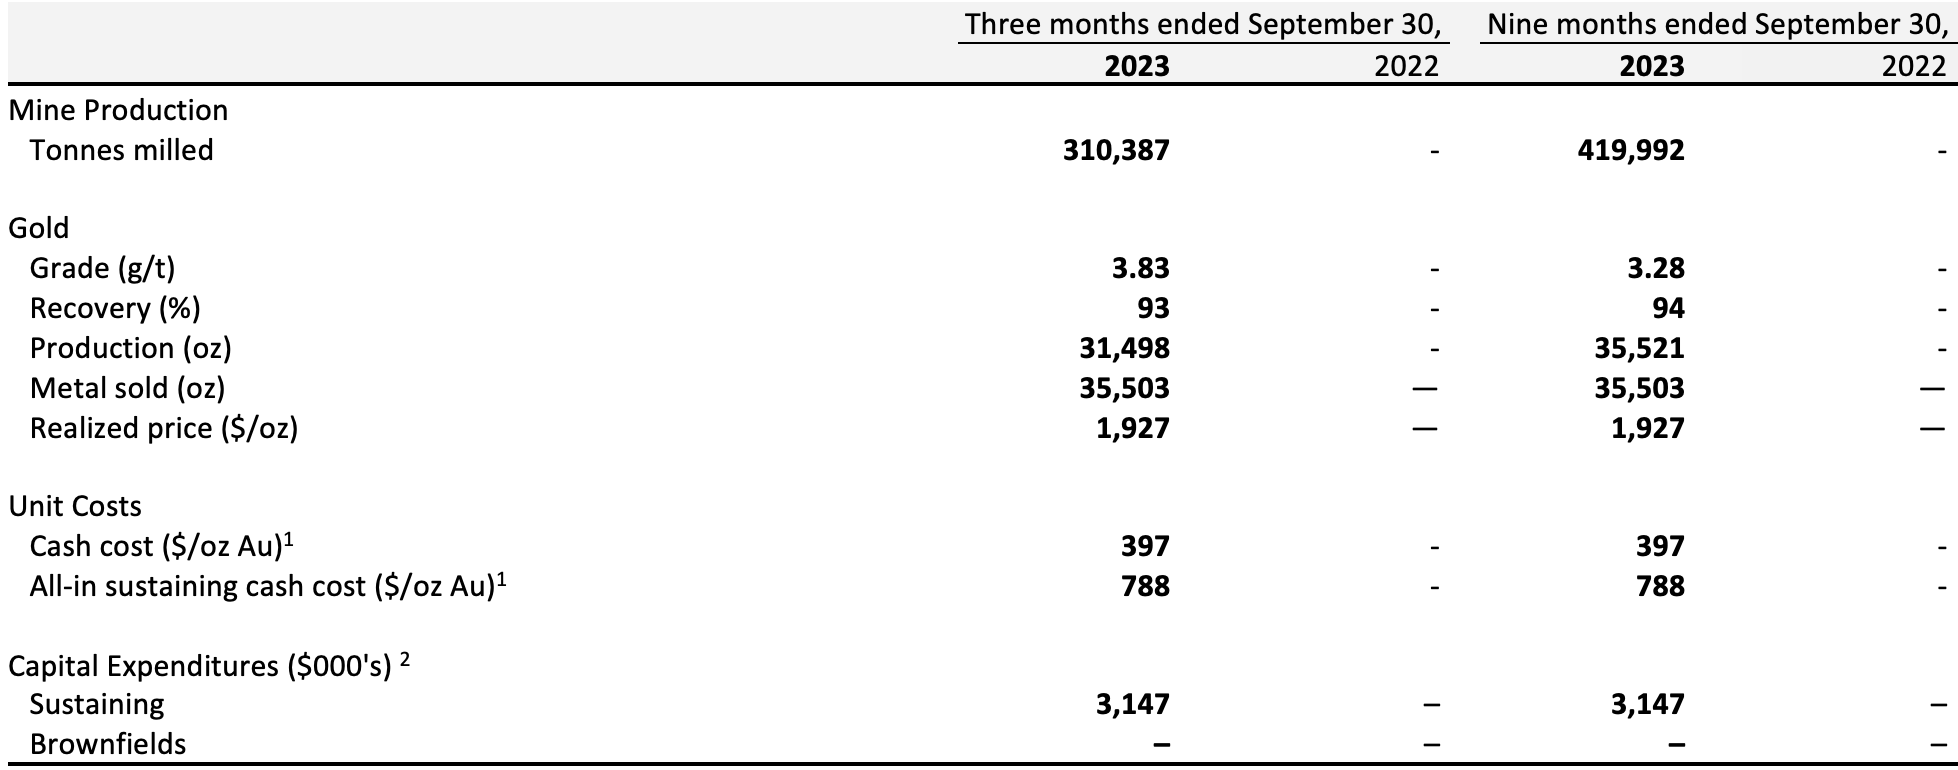
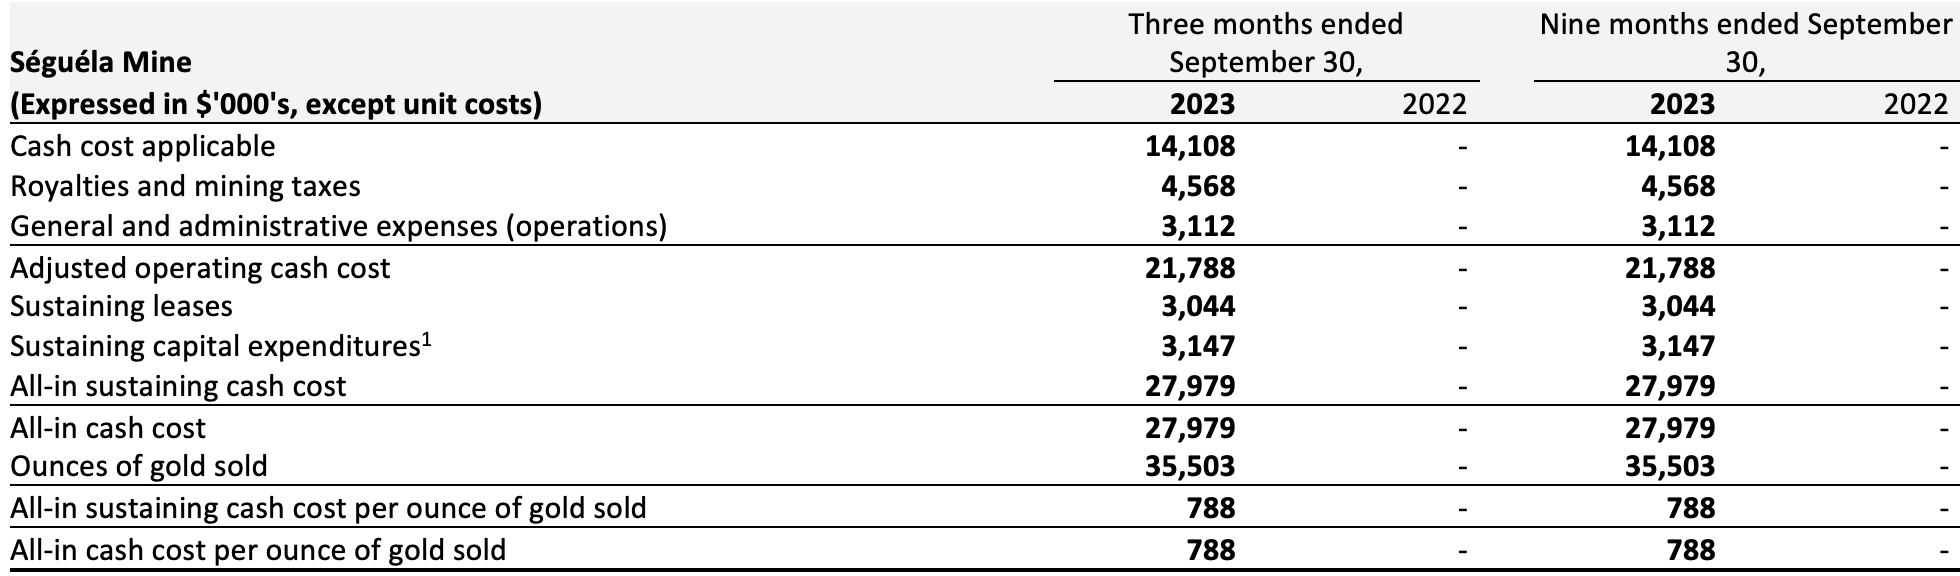
From Séguéla’s first gold pour on May 24th to the successful completion of the processing plant performance test in August, the operation is now exceeding nameplate capacity. Séguéla is well positioned to achieve the mid-point of its gold production guidance of 60 to 75 thousand ounces for the second half of 2023.
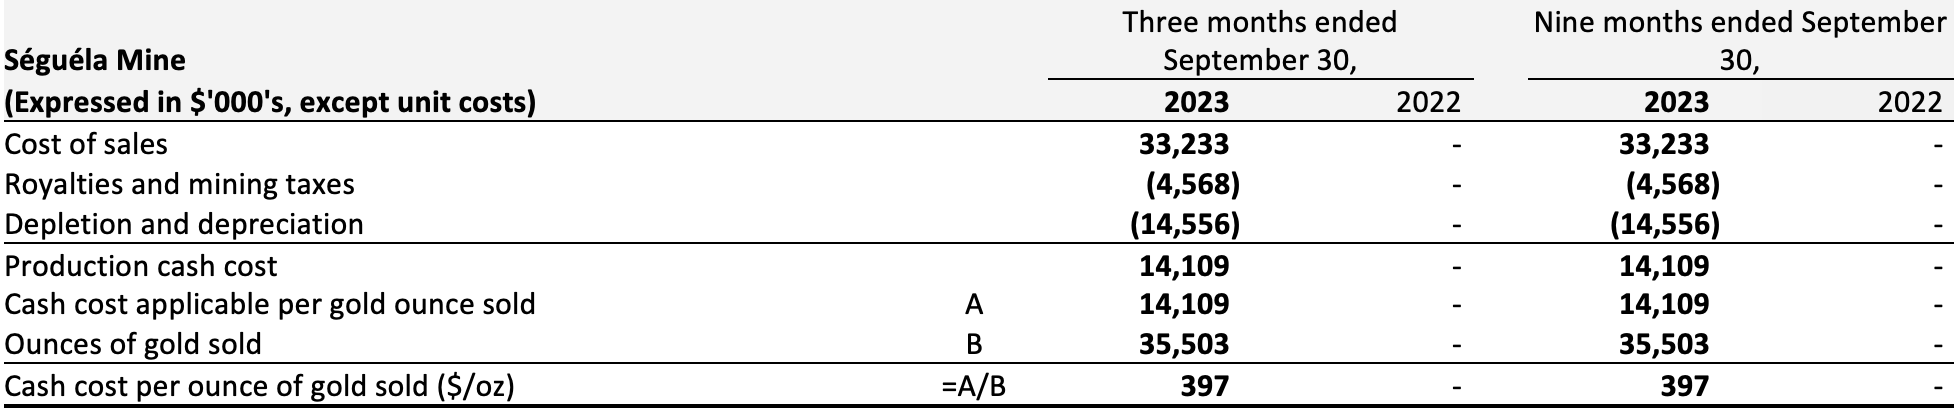
In the third quarter of 2023, mine production totaled 502,326 tonnes of ore, averaging 3.48 g/t Au, and containing an estimated 56,136 ounces of gold from the Antenna Pit. Movement of waste during the quarter totaled 1,156,540 tonnes, for a strip ratio of 2.3:1.
Cash cost per gold ounce sold was $397 for Q3 2023, which was below plan, primarily higher due to head grades and lower energy and diesel consumption.
All-in sustaining cash cost per gold ounce sold was $788 for Q3 2023, which was below plan, primarily due to lower cash cost, lower capital expenditures, and higher sale volume.
Sustaining capital for Q3 2023 consisted primarily of mine development. The first stage of grade control drilling was completed at the Ancien deposit during the third quarter, with results currently being processed. Construction of the access road continued as planned, with stripping and initial mining of oxide material scheduled to begin this quarter.
At the Koula deposit, initial grade control drilling started and should be completed early this quarter.
San Jose Mine, Mexico
1 Production cash cost per ounce of silver equivalent and All-in sustaining cash cost per ounce of silver equivalent are calculated using realized metal prices for each period respectively.
2 Production cash cost per tonne, production cash cost per ounce of silver equivalent, and all-in sustaining cash cost per ounce of silver equivalent are non-IFRS financial measures, refer to non-IFRS financial measures section at the end of this news release and to the MD&A accompanying the Company’s financial statements filed on SEDAR+ at www.sedarplus.ca for a description of the calculation of these measures.
3 Capital expenditures are presented on a cash basis
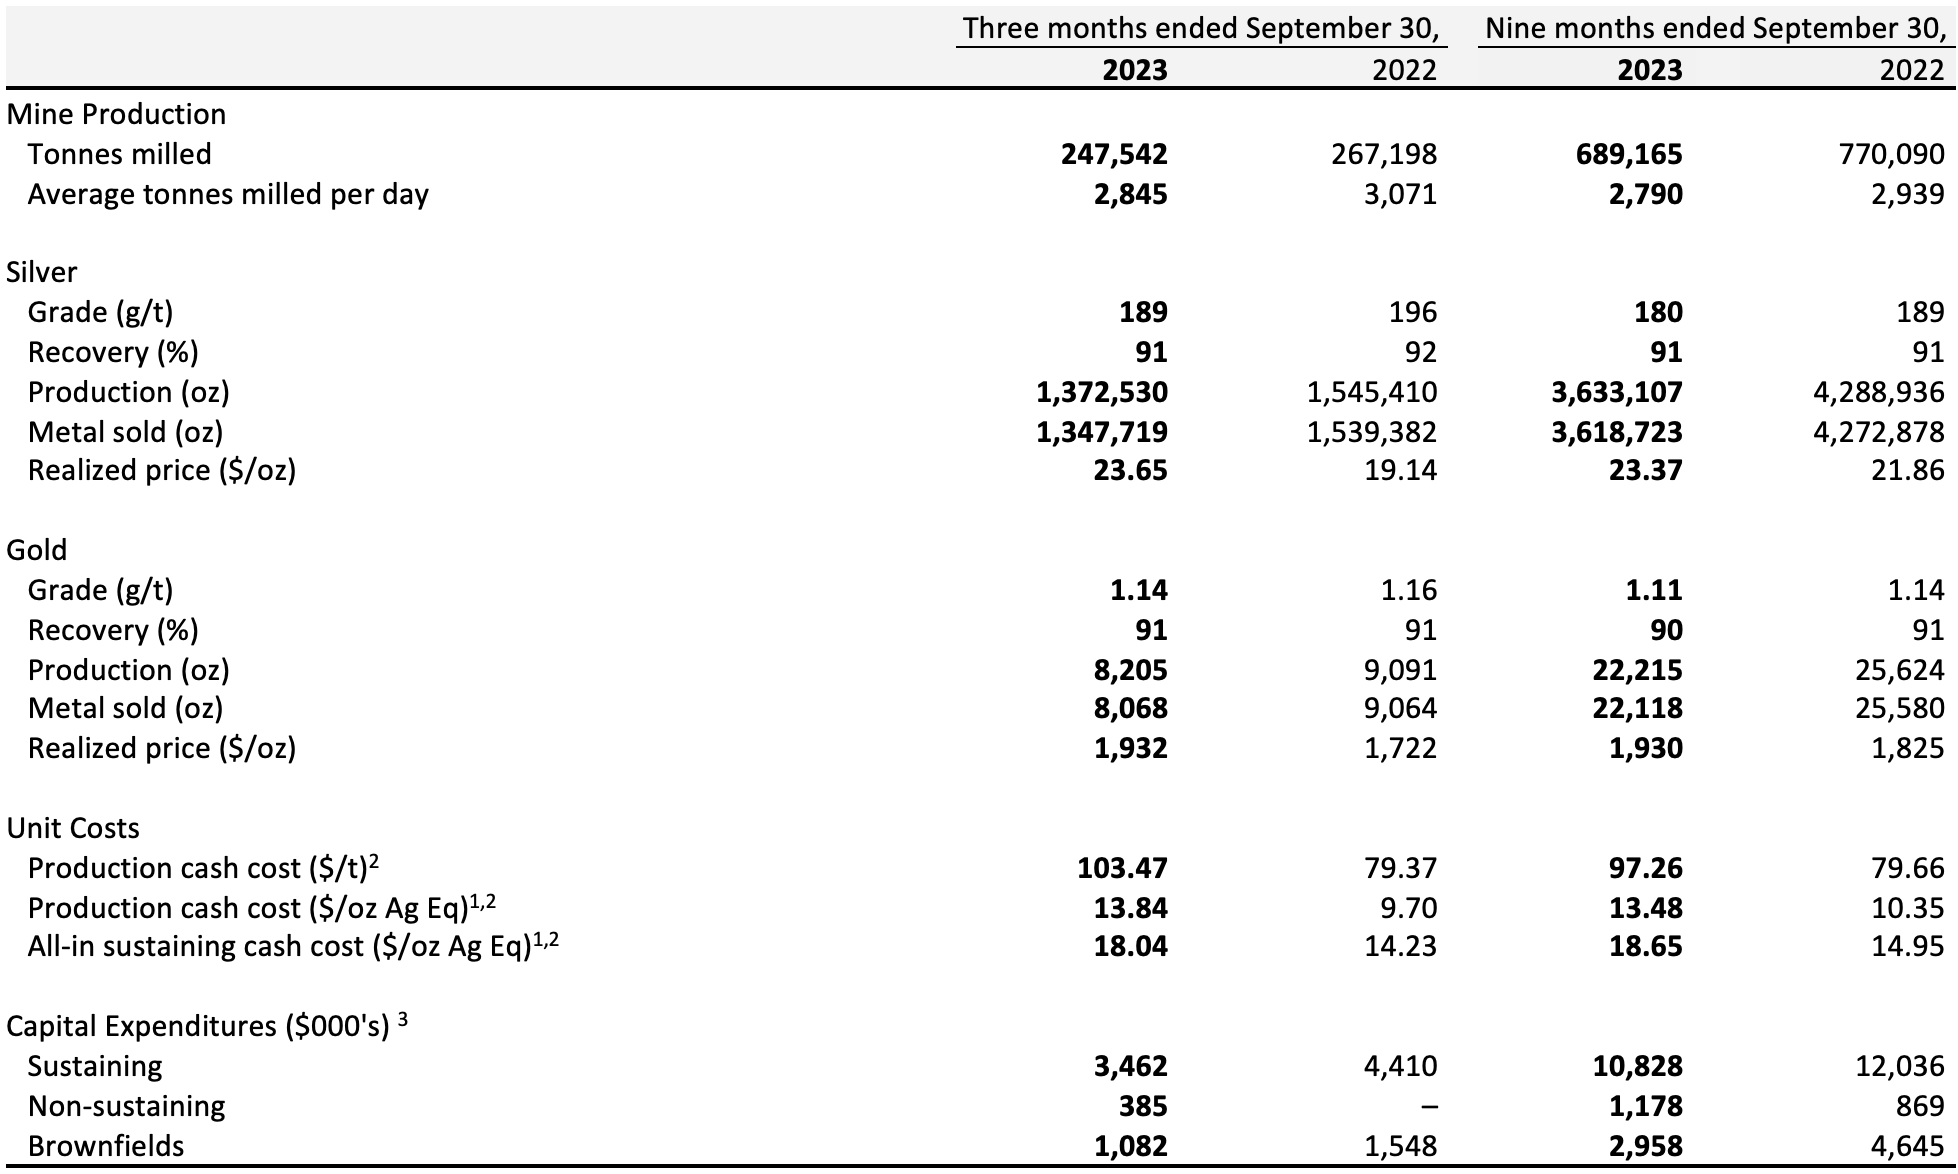
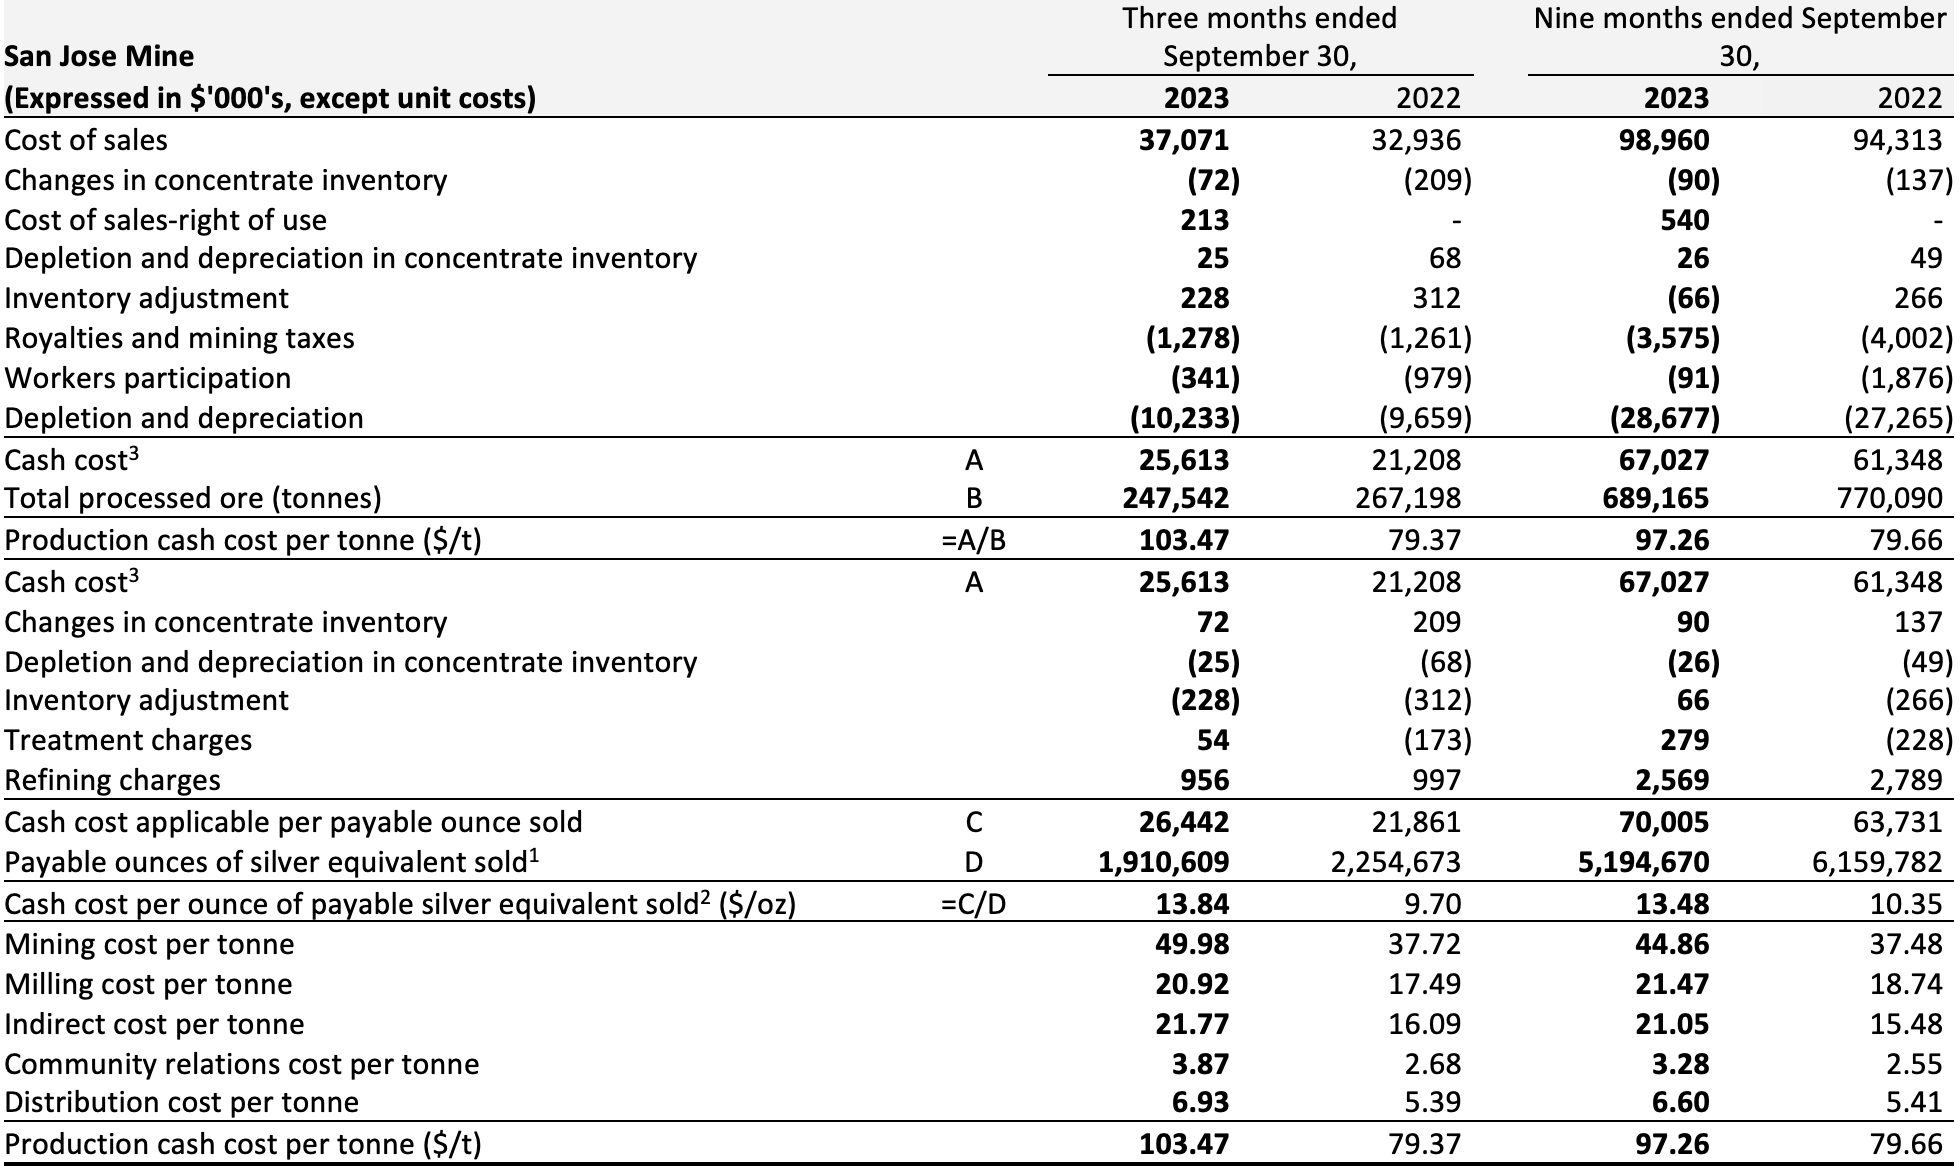
In the third quarter of 2023, the San Jose Mine produced 1,372,530 ounces of silver at an average head grade of 189 g/t Ag and 8,205 ounces of gold at an average head grade of 1.14 g/t Au, 11% and 10% lower, respectively, when compared to the same period in 2022. The decrease in silver and gold production for the third quarter of 2023, when compared to the third quarter of 2022, is explained by the declining grade profile of Mineral Reserves in the mine plan. The processing plant milled 247,542 tonnes at an average of 2,845 tonnes per day during the third quarter, in line with the plan for the period.
Gold production is expected to fall slightly below the annual guidance range of 34 to 37 thousand ounces, resulting from lost production days in the second quarter due to the illegal union blockade, and gold head grade reconciliation to reserves in the low end of range. The San Jose Mine remains positioned to deliver annual silver production within the guidance range of between 5.3 to 5.8 million ounces.
The cash cost per tonne for the three months ended September 30, 2023, was $103.47 compared to $79.37 in the same period in 2022. The increase was primarily due to higher use of contractors to make up for lost production in the second quarter of 2023 related to the illegal blockade, higher maintenance and indirect costs and the appreciation of the Mexican Peso.
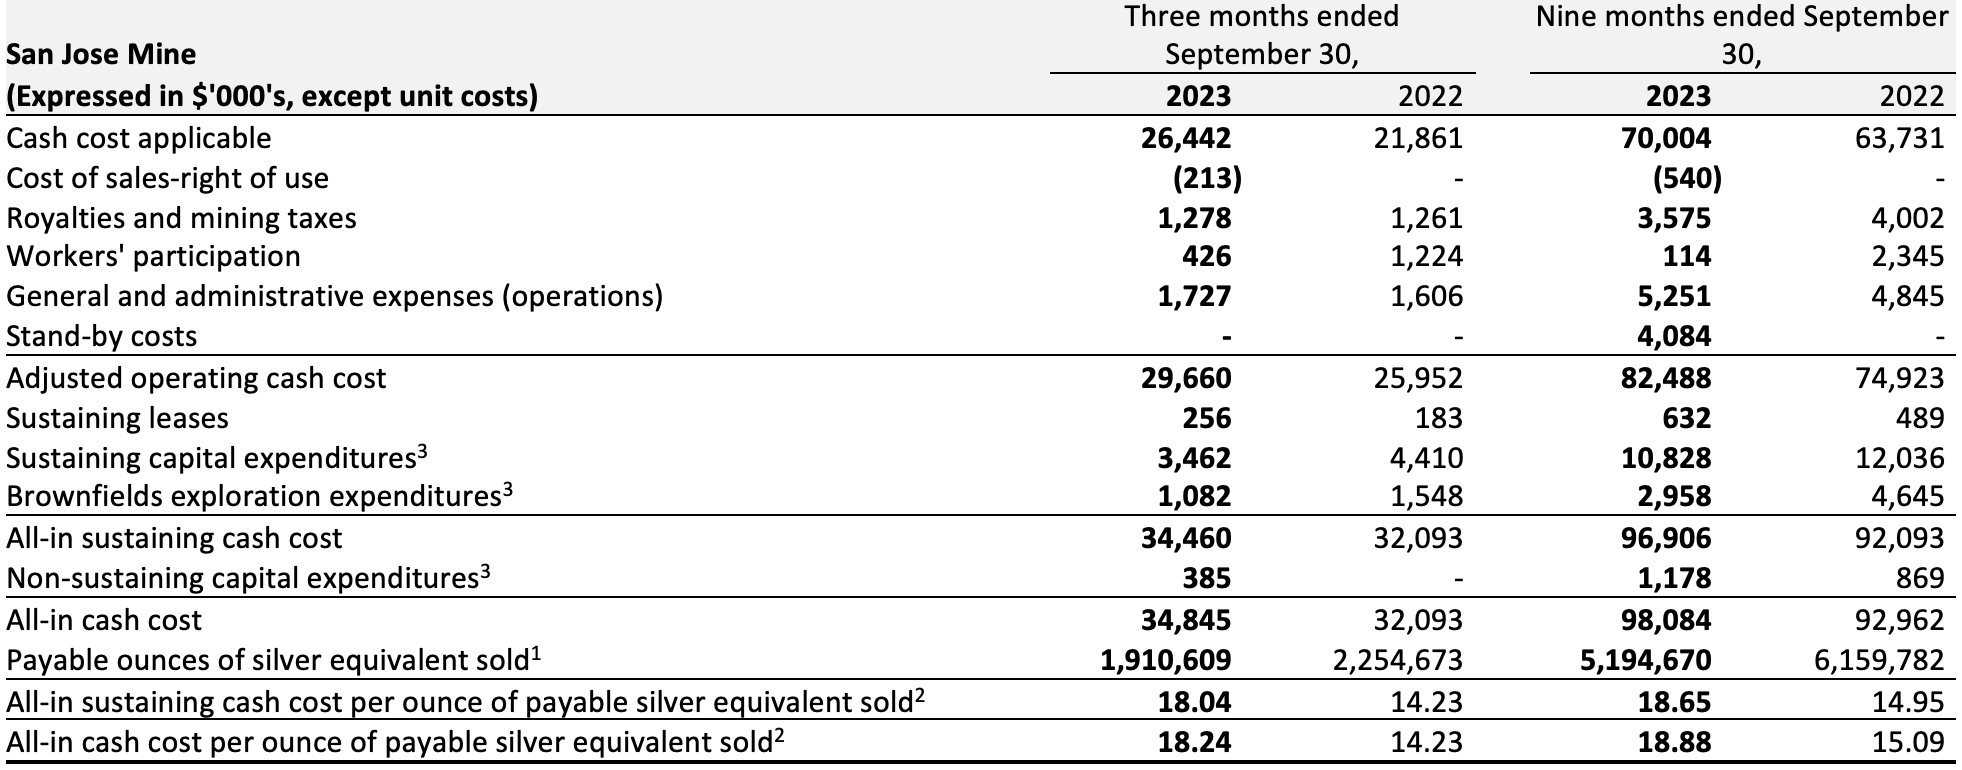
All-in sustaining cash cost of payable silver equivalent for the three months ended September 30, 2023, increased 26% to $18.04 per ounce, compared to $14.23 per ounce for the same period in 2022. The increase was driven by higher cash cost, lower production, and lower equivalent silver ounces per gold ounce. This was offset slightly by lower capital expenditures and lower workers’ participation costs.
In the third quarter of 2023, sustaining capital expenditures were higher than the same period in 2022. This increase was primarily due to the execution of development meters, which had been postponed from Q2 2023 because of the blockade. Brownfields expenditures were in line with the plan. Expenditures are however expected to increase, due to the emergent drilling campaign at the Yessi vein.
Infill drilling at the San Jose Mine during the quarter led to the discovery of the Yessi vein, a blind structure, located 200 horizontal meters from existing underground infrastructure. The discovery hole SJOM-1387 intersected 1,299 g/t Ag Eq over 9.9 meters, and drill hole SJOM-1391 intersected 621 g/t Ag Eq over 5 meters (Refer to the News Release filled on SEDAR+ on September 5, 2023 titled “Fortuna intersects 1,299 g/t Ag Eq over a true width of 9.9 meters at the San Jose Mine, Mexico” for full details of the drilling program). Additional drilling is currently underway from both surface and underground to define the extent and geometry of this discovery. Mineralization remains open along strike to the north and south, and at depth.
Caylloma Mine, Peru
1 Production cash cost per ounce of silver equivalent and All-in sustaining cash cost per ounce of silver equivalent are calculated using realized metal prices for each period respectively.
2 Production cash cost per tonne, production cash cost per ounce of silver equivalent, and all-in sustaining cash cost per ounce of silver equivalent are non-IFRS financial measures, refer to non-IFRS financial measures section at the end of this news release and to the MD&A accompanying the Company’s financial statements filed on SEDAR+ at www.sedarplus.ca for a description of the calculation of these measures.
3 Capital expenditures are presented on a cash basis.
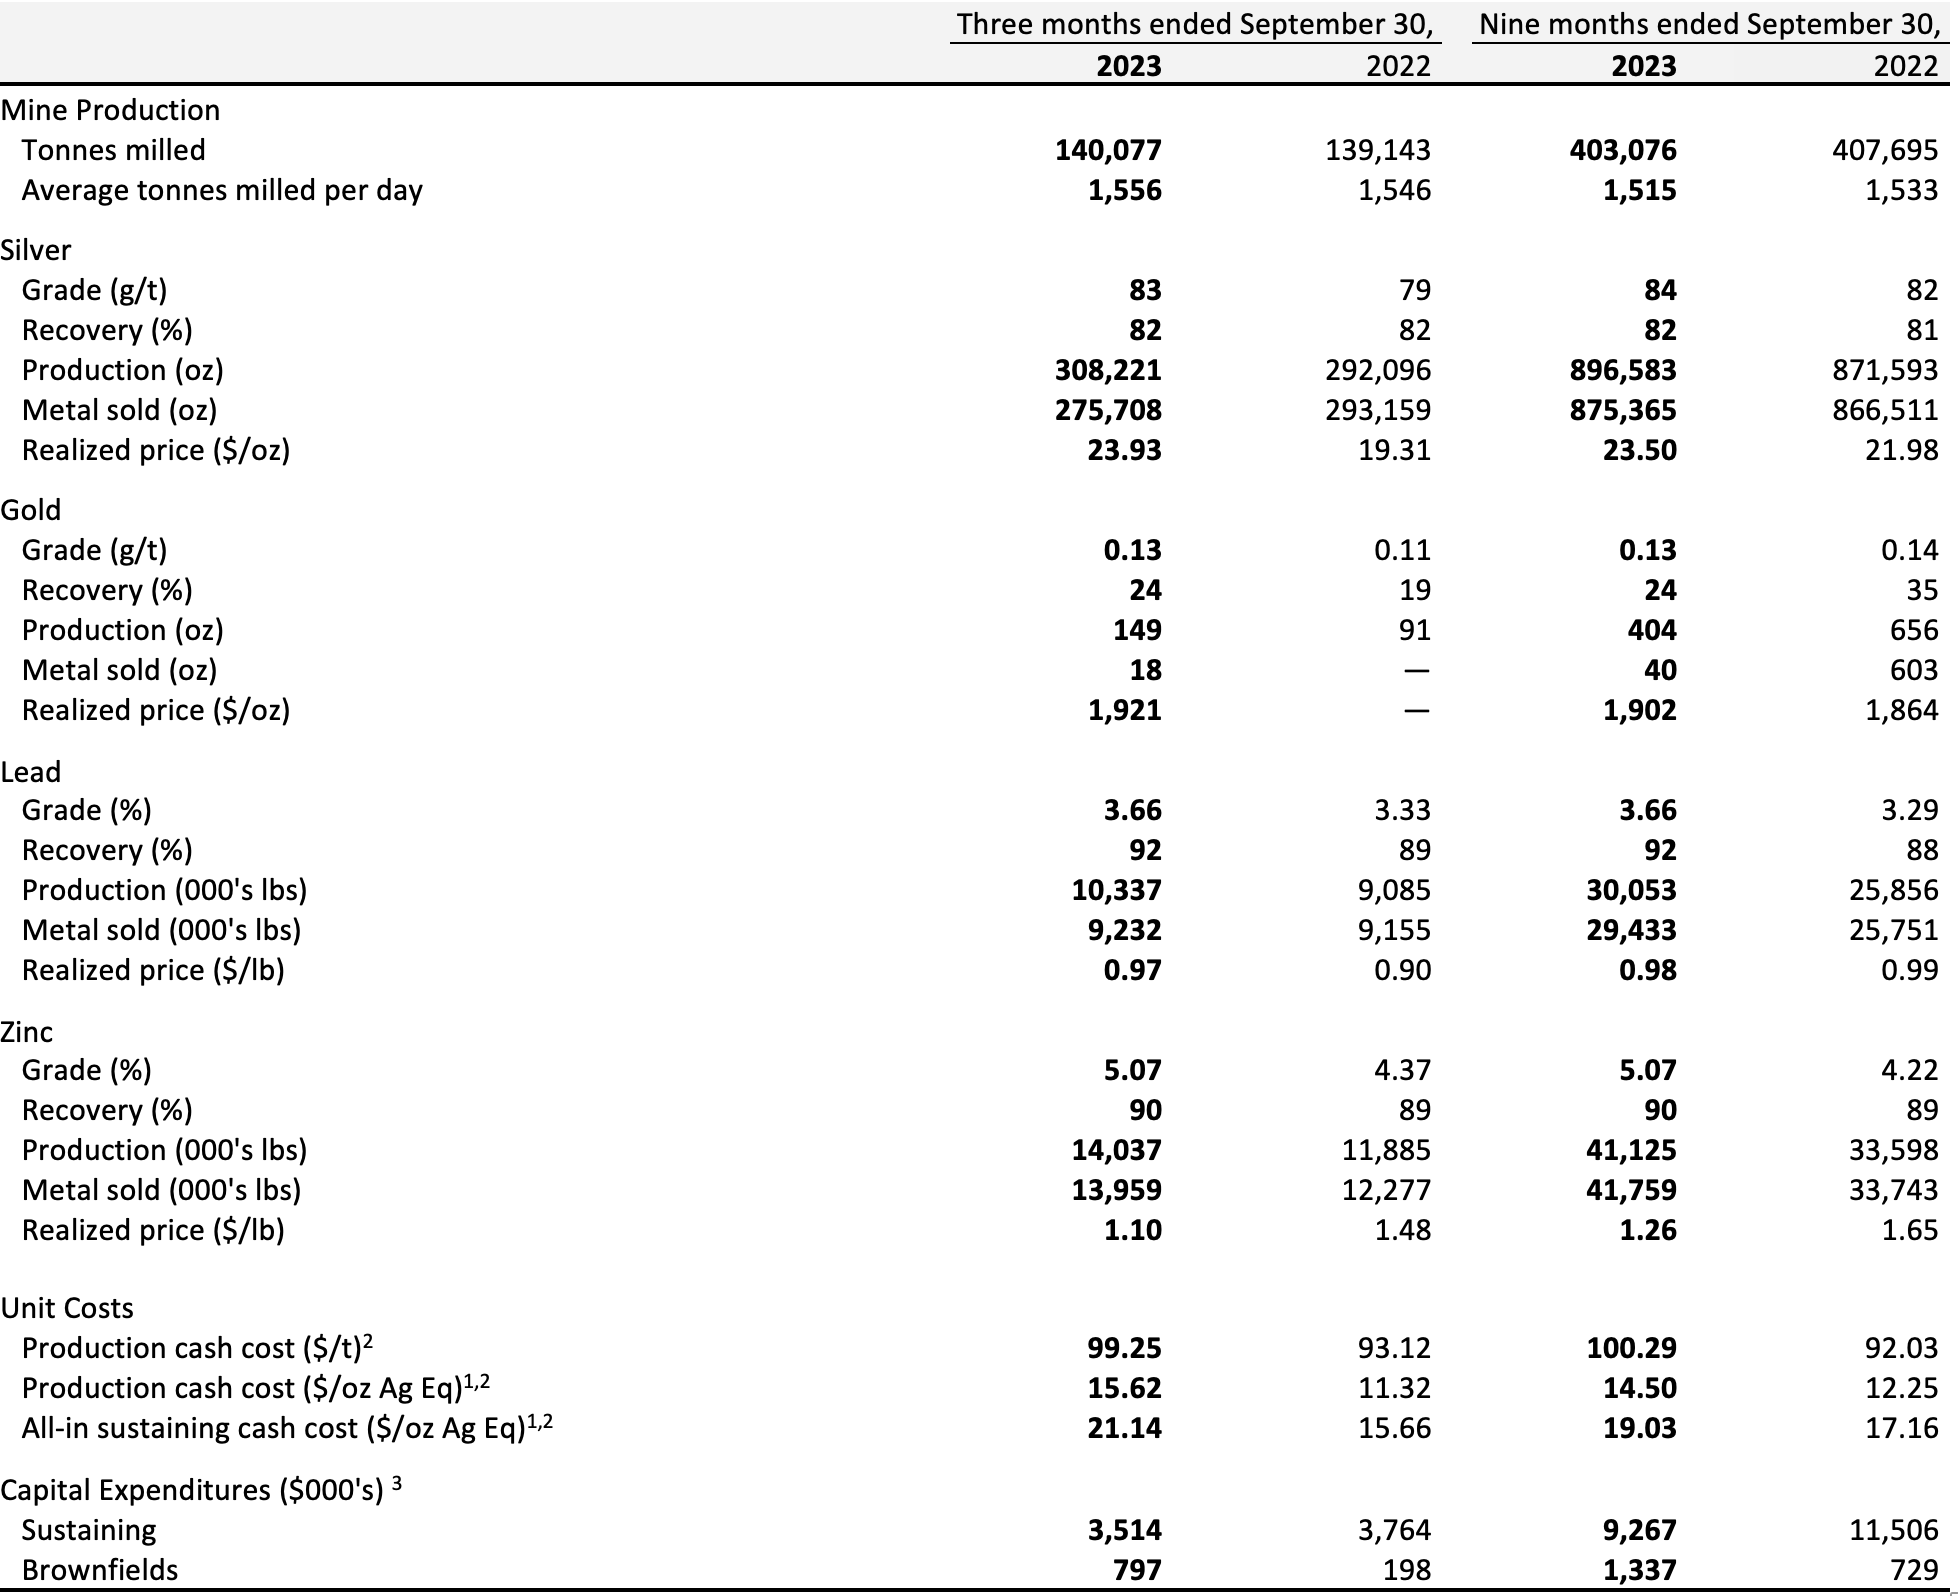
The Caylloma Mine produced 308,221 ounces of silver, 10.3 million pounds of lead, and 14.0 million pounds of zinc during the third quarter of 2023. Silver production was 6% higher compared to the same quarter in 2022. Lead and zinc production rose by 14% and 18% respectively, compared to the same period in 2022. Increased production was the result of positive grade reconciliation to the reserve model in levels 16 and 18 of the Animas vein. Increased recoveries for lead and zinc were also driven by the higher grades. Gold production totaled 149 ounces with an average head grade of 0.13 g/t.
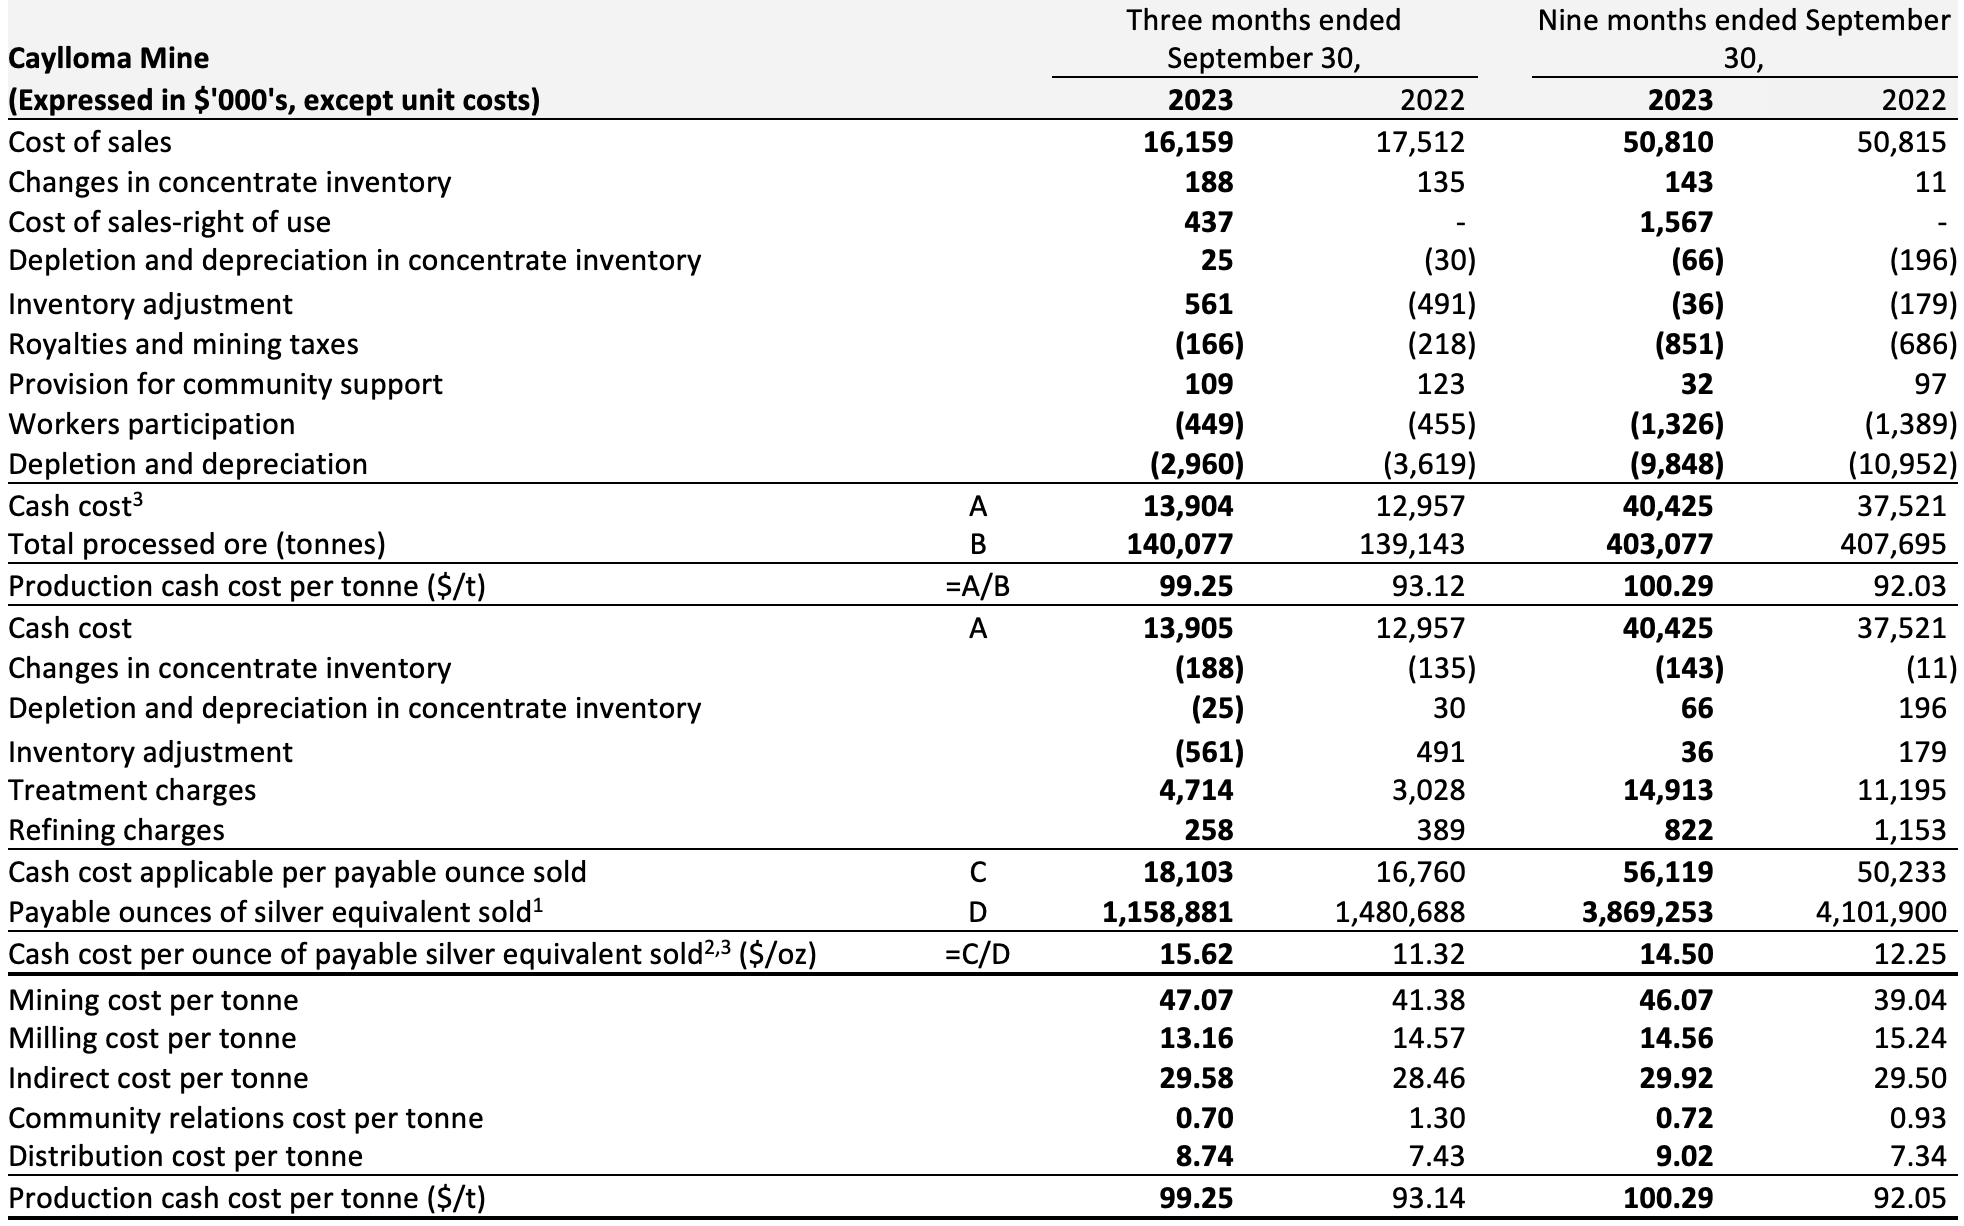
The cash cost per tonne of processed ore for the three months ended September 30, 2023, increased 7% to $99.25 compared to $93.12 in the same period in 2022. This increase was primarily due to higher processing and indirect costs.
The all-in sustaining cash cost per ounce of payable silver equivalent for the three months ended September 30, 2023, increased 35% to $21.14, compared to $15.66 for the same period in 2022. The increase was driven by higher cash cost and the impact of metal prices on the calculation of silver equivalent ounces.
Capital costs for the period mainly consisted of underground development in mine levels 15, 16, and 18. The increase in Brownfields expenditures is primarily attributable to additional long hole drilling.
Qualified Person
Eric Chapman, Senior Vice President of Technical Services, is a Professional Geoscientist of the Engineers and Geoscientists of British Columbia (Registration Number 36328), and is the Company’s Qualified Person (as defined by National Instrument 43-101). Mr. Chapman has reviewed and approved the scientific and technical information contained in this news release and has verified the underlying data.
Non-IFRS Financial Measures
The Company has disclosed certain financial measures and ratios in this news release which are not defined under the International Financial Reporting Standards (“IFRS”), as issued by the International Accounting Standards Board, and are not disclosed in the Company's financial statements, including but not limited to: cash cost per ounce of gold sold; all-in sustaining cash cost per ounce of gold sold; all-in sustaining cash cost per ounce of gold equivalent sold; all-in cash cost per ounce of gold sold; production cash cost per ounce of gold equivalent; total production cash cost per tonne; cash cost per payable ounce of silver equivalent sold; all-in sustaining cash cost per payable ounce of silver equivalent sold; all-in cash cost per payable ounce of silver equivalent sold; free cash flow from ongoing operations; adjusted net income; adjusted EBITDA and working capital.
These non-IFRS financial measures and non-IFRS ratios are widely reported in the mining industry as benchmarks for performance and are used by management to monitor and evaluate the Company's operating performance and ability to generate cash. The Company believes that, in addition to financial measures and ratios prepared in accordance with IFRS, certain investors use these non-IFRS financial measures and ratios to evaluate the Company’s performance. However, the measures do not have a standardized meaning under IFRS and may not be comparable to similar financial measures disclosed by other companies. Accordingly, non-IFRS financial measures and non-IFRS ratios should not be considered in isolation or as a substitute for measures and ratios of the Company’s performance prepared in accordance with IFRS. The Company has calculated these measures consistently for all periods presented.
To facilitate a better understanding of these measures and ratios as calculated by the Company, descriptions are provided below. In addition see “Non-IFRS Financial Measures” in the Company’s management’s discussion and analysis for the three and nine months ended September 30, 2023 (“Q3 2023 MDA”), which section is incorporated by reference in this news release, for additional information regarding each non-IFRS financial measure and non-IFRS ratio disclosed in this news release, including an explanation of their composition; an explanation of how such measures and ratios provide useful information to an investor and the additional purposes, if any, for which management of the Company uses such measures and ratio. The Q3 2023 MD&A may be accessed on SEDAR+ at www.sedarplus.ca under the Company’s profile.
Except as otherwise described in the Q3 2023 MD&A, the Company has calculated these measures consistently for all periods presented.
Reconciliation to Total Net debt and Net debt to Adjusted EBITDA ratio for September 30, 2023
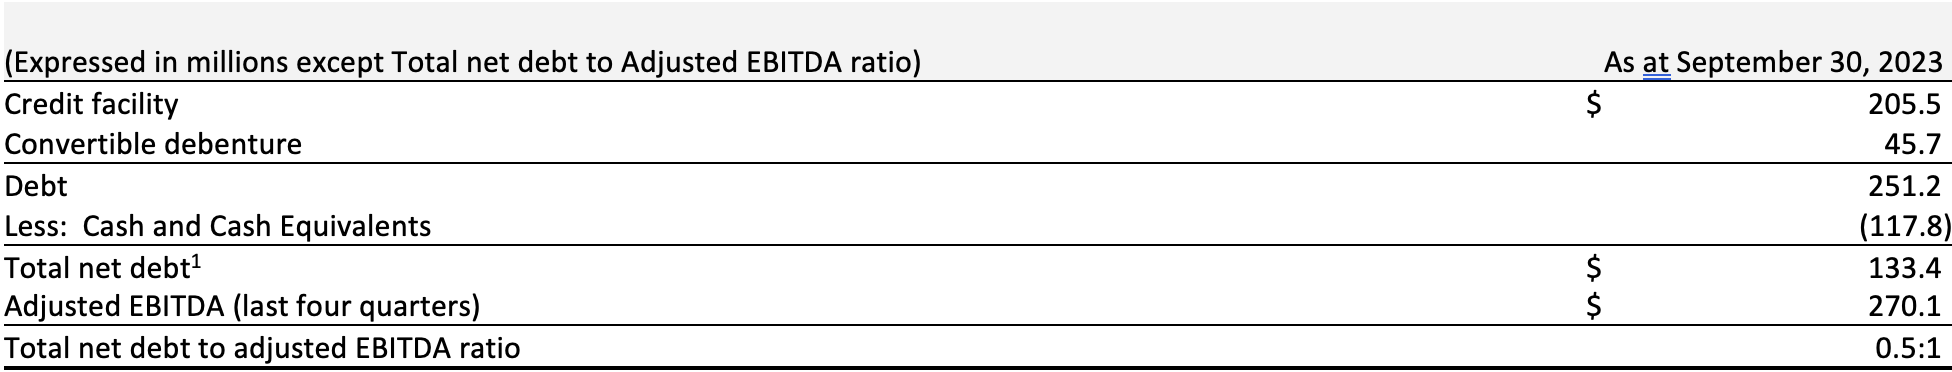
1 Excluding letters of credit
Reconciliation to adjusted attributable net income for the three and nine months ended September 30, 2023 and 2022
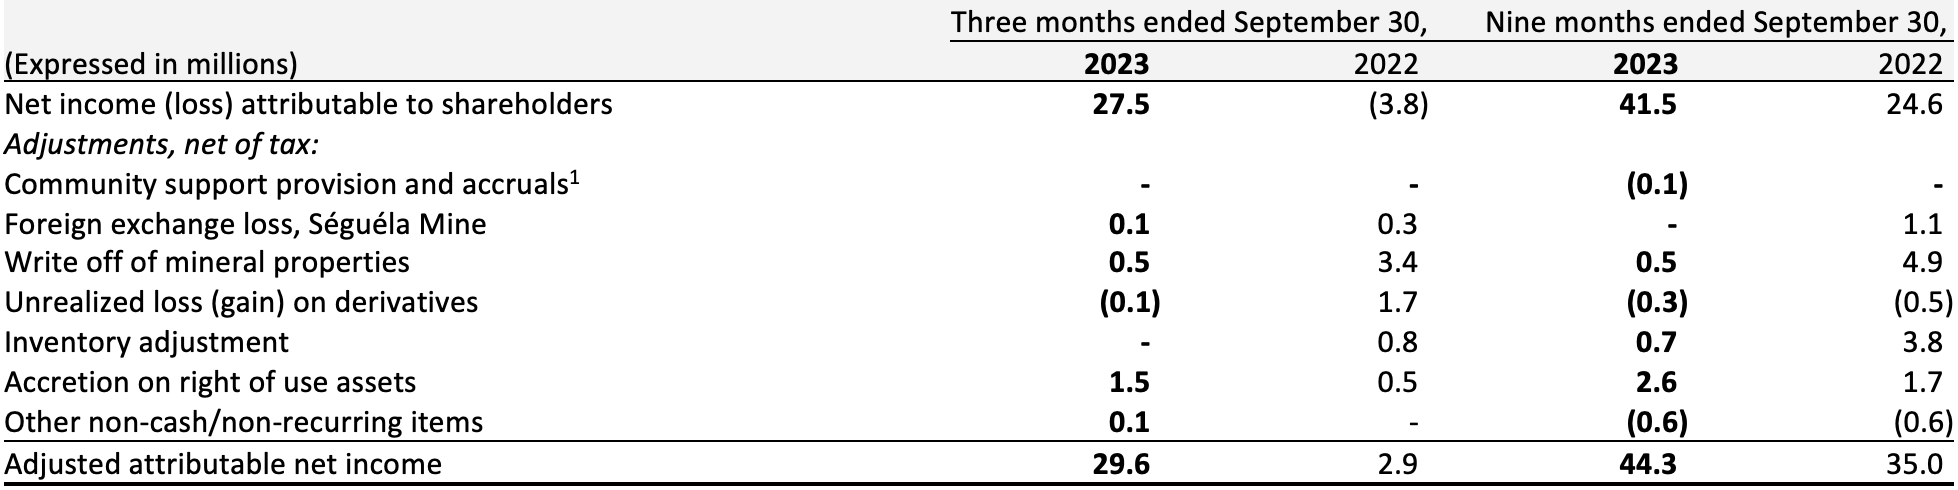
1 Amounts are recorded in Cost of sales
Reconciliation to adjusted attributable net income for the three months ended June 30, 2023
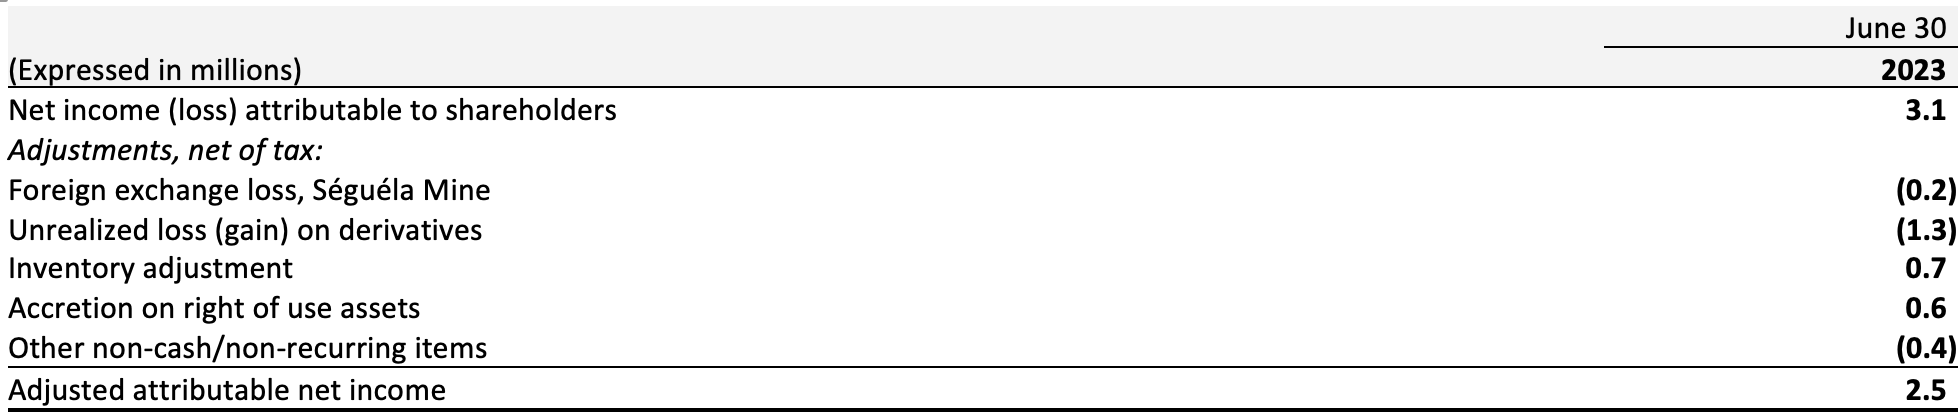
1 Amounts are recorded in Cost of sales
Reconciliation to adjusted EBITDA for the three and nine months ended September 30, 2023 and 2022
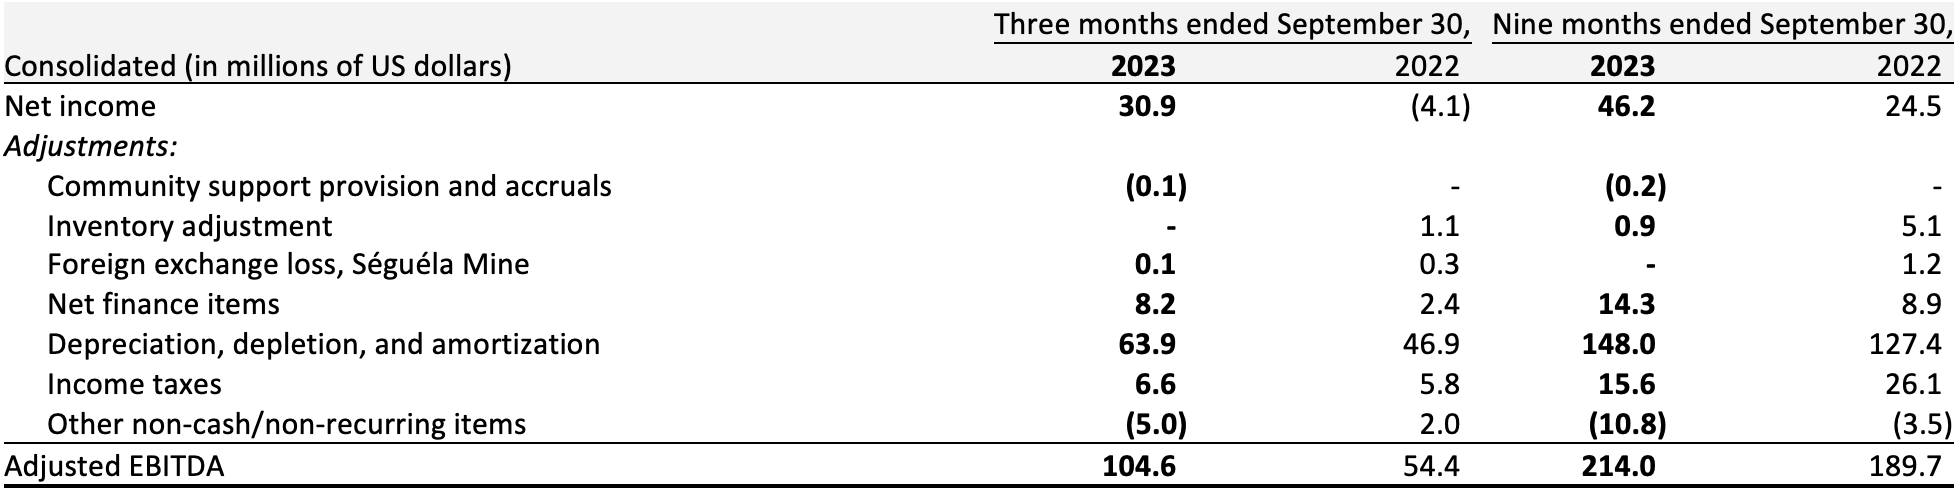
Figures may not add due to rounding
Reconciliation of free cash flow from ongoing operations for the three and nine months ended September 30, 2023 and 2022
In 2022, the Company changed the method for calculating free cash flow from ongoing operations. The calculation now uses taxes paid as opposed to the previous method which used current income taxes. While this may create larger quarter over quarter fluctuations due to the timing of income tax payments, management believes the revised method is a better representation of the free cash flow generated by the Company’s ongoing operations.
Figures may not add due to rounding
Reconciliation of cash cost per ounce of gold sold for the three and nine months ended September 30, 2023 and 2022
Reconciliation of cash cost per ounce of gold equivalent sold for the three and nine months ended September 30, 2023 and 2022

Gold equivalent was calculated using the realized prices for gold of $1,924/oz Au, $23.7/oz Ag, $2,136/t Pb, and $2,428/t Zn for Q3 2023 and using the realized prices for gold of $1,718/oz Au, $19.2/oz Ag, $1,989/t Pb, and $3,268/t Zn for Q3 2022.
Gold equivalent was calculated using the realized prices for gold of $1,927/oz Au, $23.4/oz Ag, $2,162/t Pb, and $2,778/t Zn for YTD 2023 and using the realized prices for gold of $1,823/oz Au, $21.9/oz Ag, $2,181/t Pb, and $3,634/t Zn for YTD 2022.
Reconciliation of all-in sustaining cash cost per ounce of gold sold for the three and nine months ended September 30, 2023 and 2022
1 Presented on a cash basis
1 Presented on a cash basis
1 Presented on a cash basis
Reconciliation of all-in sustaining cash cost per ounce of gold equivalent sold for the three and nine months ended September 30, 2023 and 2022
Gold equivalent was calculated using the realized prices for gold of $1,924/oz Au, $23.7/oz Ag, $2,136/t Pb, and $2,428/t Zn for Q3 2023 and using the realized prices for gold of $1,718/oz Au, $19.2/oz Ag, $1,989/t Pb, and $3,268/t Zn for Q3 2022.
Gold equivalent was calculated using the realized prices for gold of $1,927/oz Au, $23.4/oz Ag, $2,162/t Pb, and $2,778/t Zn for YTD 2023 and using the realized prices for gold of $1,823/oz Au, $21.9/oz Ag, $2,181/t Pb, and $3,634/t Zn for YTD 2022.
Reconciliation of production cash cost per tonne and cash cost per payable ounce of silver equivalent sold for the three and nine months ended September 30, 2023 and 2022
1 Silver equivalent sold for Q3 2023 is calculated using a silver to gold ratio of 81.7:1 (Q3 2022: 90.0:1). Silver equivalent sold for YTD 2023 is calculated using silver to gold ratio of 82.6:1 (YTD 2022: 83.5:1)
2 Silver equivalent is calculated using the realized prices for gold and silver. Refer to Financial Results – Sales and Realized Prices
1 Silver equivalent sold for Q3 2023 is calculated using a silver to gold ratio of 80.3:1 (Q3 2022: 0.0:1), silver to lead ratio of 1:24.7 pounds (Q3 2022: 1:21.4), and silver to zinc ratio of 1:21.7 pounds (Q3 2022: 1:13.0). Silver equivalent sold for YTD 2023 is calculated using a silver to gold ratio of 80.9:1 (YTD 2022: 84.8:1), silver to lead ratio of 1:24.0 pounds (YTD 2022: 1:22.2), and silver to zinc ratio of 1:18.6 pounds (YTD 2022: 1:13.3).
2 Silver equivalent is calculated using the realized prices for gold, silver, lead, and zinc. Refer to Financial Results - Sales and Realized Prices
Reconciliation of all-in sustaining cash cost and all-in cash cost per payable ounce of silver equivalent sold for the three and nine months ended September 30, 2023 and 2022
1 Silver equivalent sold for Q3 2023 is calculated using a silver to gold ratio of 81.7:1 (Q3 2022: 90.0:1). Silver equivalent sold for YTD 2023 is calculated using silver to gold ratio of 82.6:1 (YTD 2022: 83.5:1)
2 Silver equivalent is calculated using the realized prices for gold and silver. Refer to Financial Results - Sales and Realized Prices
3 Presented on a cash basis
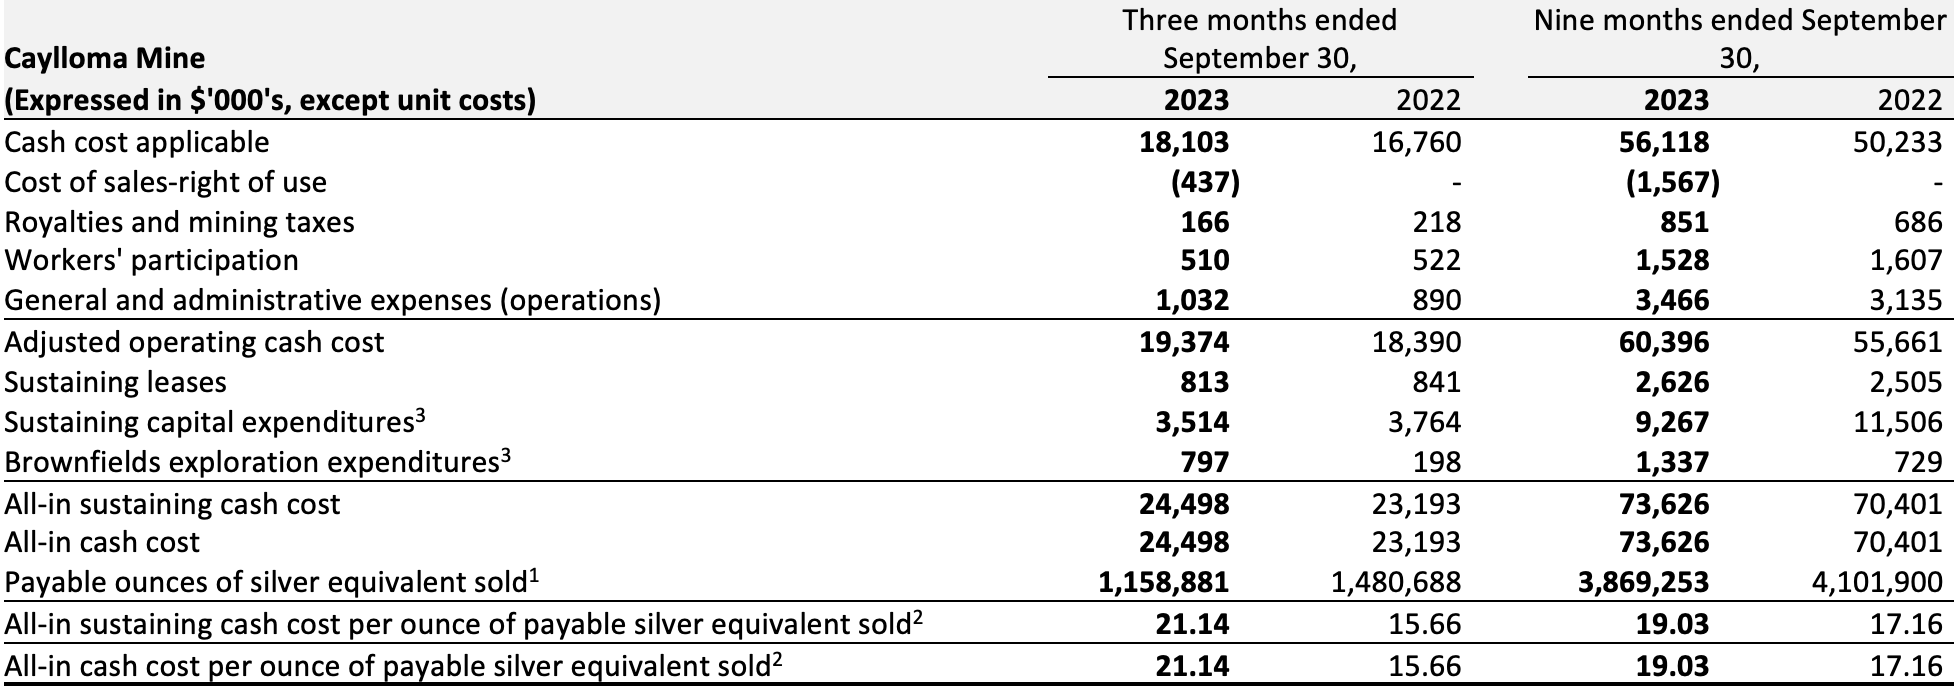
1 Silver equivalent sold for Q3 2023 is calculated using a silver to gold ratio of 80.3:1 (Q3 2022: 0.0:1), silver to lead ratio of 1:24.7 pounds (Q3 2022: 1:21.4), and silver to zinc ratio of 1:21.7 pounds (Q3 2022: 1:13.0). Silver equivalent sold for YTD 2023 is calculated using a silver to gold ratio of 80.9:1 (YTD 2022: 84.8:1), silver to lead ratio of 1:24.0 pounds (YTD 2022: 1:22.2), and silver to zinc ratio of 1:18.6 pounds (YTD 2022: 1:13.3).
2 Silver equivalent is calculated using the realized prices for gold, silver, lead, and zinc. Refer to Financial Results - Sales and Realized Prices
3 Presented on a cash basis
Additional information regarding the Company’s financial results and activities underway are available in the Company’s unaudited condensed interim consolidated financial statements for the three and nine months ended September 30, 2023 and accompanying Q3 2023 MD&A, which are available for download on the Company’s website, www.fortunasilver.com, on SEDAR+ at www.sedarplus.ca and on EDGAR at www.sec.gov/edgar.
Conference Call and Webcast
A conference call to discuss the financial and operational results will be held on Thursday, November 9, 2023, at 9:00 a.m. Pacific time | 12:00 p.m. Eastern time. Hosting the call will be Jorge A. Ganoza, President and CEO, Luis D. Ganoza, Chief Financial Officer, Cesar Velasco, Chief Operating Officer - Latin America, and David Whittle, Chief Operating Officer - West Africa.
Shareholders, analysts, media and interested investors are invited to listen to the live conference call by logging onto the webcast at: https://www.webcaster4.com/Webcast/Page/1696/49330 or over the phone by dialing in just prior to the starting time.
Conference call details:
Date: Thursday, November 9, 2023
Time: 9:00 a.m. Pacific time | 12:00 p.m. Eastern time
Dial in number (Toll Free): +1.888.506.0062
Dial in number (International): +1.973.528.0011
Access code: 101879
Replay number (Toll Free): +1.877.481.4010
Replay number (International): +1.919.882.2331
Replay passcode: 49330
Playback of the earnings call will be available until Thursday, November 23, 2023. Playback of the webcast will be available until Saturday, November 9, 2024. In addition, a transcript of the call will be archived on the Company’s website.
About Fortuna Silver Mines Inc.
Fortuna Silver Mines Inc. is a Canadian precious metals mining company with five operating mines in Argentina, Burkina Faso, Côte d’Ivoire, Mexico, and Peru. Sustainability is integral to all our operations and relationships. We produce gold and silver and generate shared value over the long-term for our stakeholders through efficient production, environmental protection, and social responsibility. For more information, please visit our website.
ON BEHALF OF THE BOARD
Jorge A. Ganoza
President, CEO, and Director
Fortuna Silver Mines Inc.
Investor Relations:
Carlos Baca | moc.revlisanutrof@ofni | www.fortunasilver.com | X | LinkedIn | YouTube
Forward-looking Statements
This news release contains forward-looking statements which constitute "forward-looking information" within the meaning of applicable Canadian securities legislation and "forward-looking statements" within the meaning of the "safe harbor" provisions of the Private Securities Litigation Reform Act of 1995 (collectively, "Forward-looking Statements"). All statements included herein, other than statements of historical fact, are Forward-looking Statements and are subject to a variety of known and unknown risks and uncertainties which could cause actual events or results to differ materially from those reflected in the Forward-looking Statements. The Forward-looking Statements in this news release include, without limitation, statements about the Company's plans for its mines and mineral properties; the Company’s anticipated financial and operational performance in 2023; estimated production and costs of production for 2023, including grade and volume of metal produced and sales, revenues and cashflows, and capital costs (sustaining and non-sustaining), and operating costs, including projected production cash costs and all-in sustaining costs, and upward revisions to Yaramoko’s annual gold production guidance to 110 to 120 thousand ounces from the original guidance of 92 to 102 thousand ounces; the ability of the Company to mitigate the inflationary pressures on supplies used in its operations; estimated capital expenditures and estimated exploration spending in 2023, including amounts for exploration activities at its properties; statements regarding the Company's liquidity, access to capital; the impact of high inflation on the costs of production and the supply chain; statements regarding declining stripping ratio, expected tonnage of ore to be placed on the leach pad, and higher average grade of gold at Lindero for the fourth quarter; the Company’s expectation that the leach pad expansion project at Lindero will be completed during the second half of 2024; statements that drilling will continue on the western portion of Zone 55 at Yaramoko during the fourth quarter of 2023; statements that stripping and initial mining of oxide material at Séguéla is schedule to begin in the fourth quarter; the expected timing for completion of initial grade control drilling at the Koula deposit; the Company's business strategy, plans and outlook; the merit of the Company's mines and mineral properties; mineral resource and reserve estimates, metal recovery rates, concentrate grade and quality; changes in tax rates and tax laws, requirements for permits, anticipated approvals and other matters. Often, but not always, these Forward-looking Statements can be identified by the use of words such as "estimated", “expected”, “anticipated”, "potential", "open", "future", "assumed", "projected", "used", "detailed", "has been", "gain", "planned", "reflecting", "will", "containing", "remaining", "to be", or statements that events, "could" or "should" occur or be achieved and similar expressions, including negative variations.
Forward-looking Statements involve known and unknown risks, uncertainties and other factors which may cause the actual results, performance or achievements of the Company to be materially different from any results, performance or achievements expressed or implied by the Forward-looking Statements. Such uncertainties and factors include, among others, changes in general economic conditions and financial markets; uncertainty relating to new mining operations such as the Séguéla Mine, including the possibility that actual capital and operating costs and economic returns will differ significantly from those estimated for such projects prior to production; risks associated with war or other geo-political hostilities, such as the Ukrainian – Russian conflict, any of which could continue to cause a disruption in global economic activity; fluctuation in currencies and foreign exchange rates; increases in the rate of inflation; the imposition or any extension of capital controls in countries in which the Company operates; any changes in tax laws in Argentina and the other countries in which we operate; changes in the prices of key supplies; technological and operational hazards in Fortuna’s mining and mine development activities; risks inherent in mineral exploration; uncertainties inherent in the estimation of mineral reserves, mineral resources, and metal recoveries; changes to current estimates of mineral reserves and resources; changes to production and cost estimates; the possibility that the ruling in favour of Compania Minera Cuzcatlan S.A. de C.V. (“Minera Cuzcatlan”) to reinstate the environmental impact authorization at the San Jose mine (the “EIA”) will be successfully appealed; changes in the position of regulatory authorities with respect to the granting of approvals or permits; governmental and other approvals; changes in government, political unrest or instability in countries where Fortuna is active; labor relations issues; as well as those factors discussed under “Risk Factors” in the Company's Annual Information Form. Although the Company has attempted to identify important factors that could cause actual actions, events or results to differ materially from those described in Forward-looking Statements, there may be other factors that cause actions, events or results to differ from those anticipated, estimated or intended.
Forward-looking Statements contained herein are based on the assumptions, beliefs, expectations and opinions of management, including but not limited to the accuracy of the Company’s current mineral resource and reserve estimates; that the Company’s activities will be conducted in accordance with the Company’s public statements and stated goals; that there will be no material adverse change affecting the Company, its properties or changes to production estimates (which assume accuracy of projected ore grade, mining rates, recovery timing, and recovery rate estimates and may be impacted by unscheduled maintenance, labour and contractor availability and other operating or technical difficulties); geo-political uncertainties that may affect the Company’s production, workforce, business, operations and financial condition; the expected trends in mineral prices and currency exchange rates; that the Company will be successful in mitigating the impact of inflation on its business and operations; if an appeal is made in respect of the ruling in favour of Minera Cuzcatlan reinstating the EIA, that such appeal won’t be successful; that Minera Cuzcatlan will be successful in the legal proceedings to reinstate the environmental impact authorization at the San Jose mine; that all required approvals and permits will be obtained for the Company’s business and operations on acceptable terms; that there will be no significant disruptions affecting the Company's operations, the ability to meet current and future obligations and such other assumptions as set out herein. Forward-looking Statements are made as of the date hereof and the Company disclaims any obligation to update any Forward-looking Statements, whether as a result of new information, future events or results or otherwise, except as required by law. There can be no assurance that these Forward-looking Statements will prove to be accurate, as actual results and future events could differ materially from those anticipated in such statements. Accordingly, investors should not place undue reliance on Forward-looking Statements.
Cautionary Note to United States Investors Concerning Estimates of Reserves and Resources
Reserve and resource estimates included in this news release have been prepared in accordance with National Instrument 43-101 Standards of Disclosure for Mineral Projects ("NI 43-101") and the Canadian Institute of Mining, Metallurgy, and Petroleum Definition Standards on Mineral Resources and Mineral Reserves. NI 43-101 is a rule developed by the Canadian Securities Administrators that establishes standards for public disclosure by a Canadian company of scientific and technical information concerning mineral projects. Unless otherwise indicated, all mineral reserve and mineral resource estimates contained in the technical disclosure have been prepared in accordance with NI 43-101 and the Canadian Institute of Mining, Metallurgy and Petroleum Definition Standards on Mineral Resources and Reserves. Canadian standards, including NI 43-101, differ significantly from the requirements of the Securities and Exchange Commission, and mineral reserve and resource information included in this news release may not be comparable to similar information disclosed by U.S. companies.