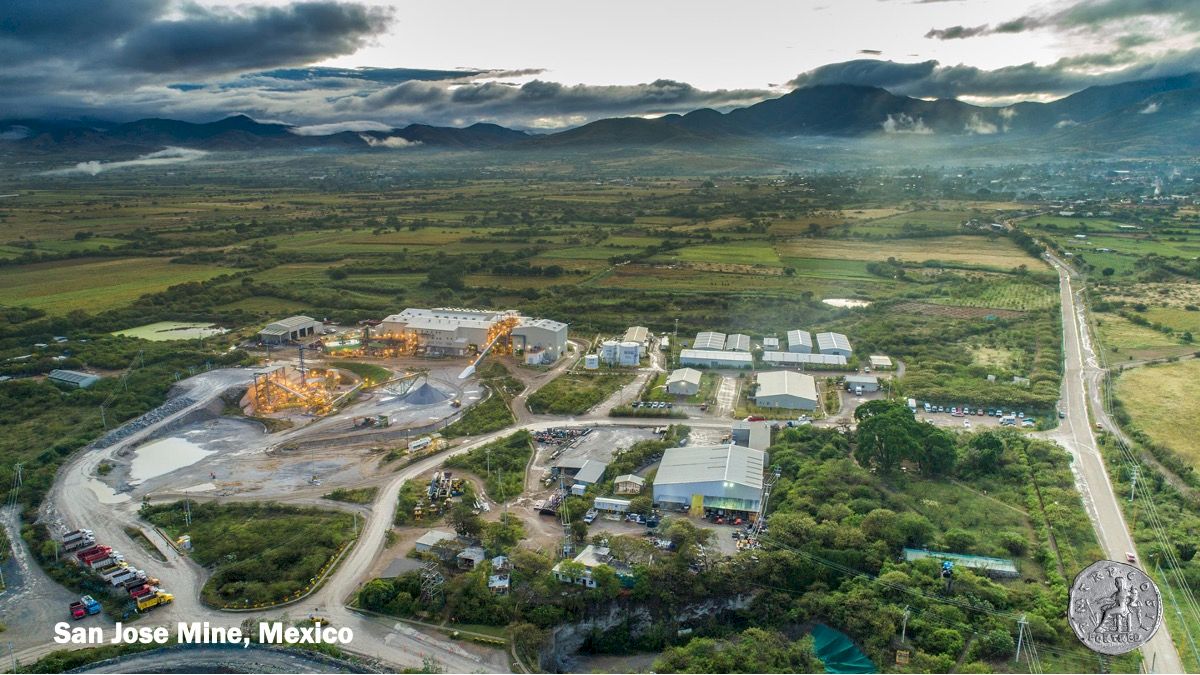
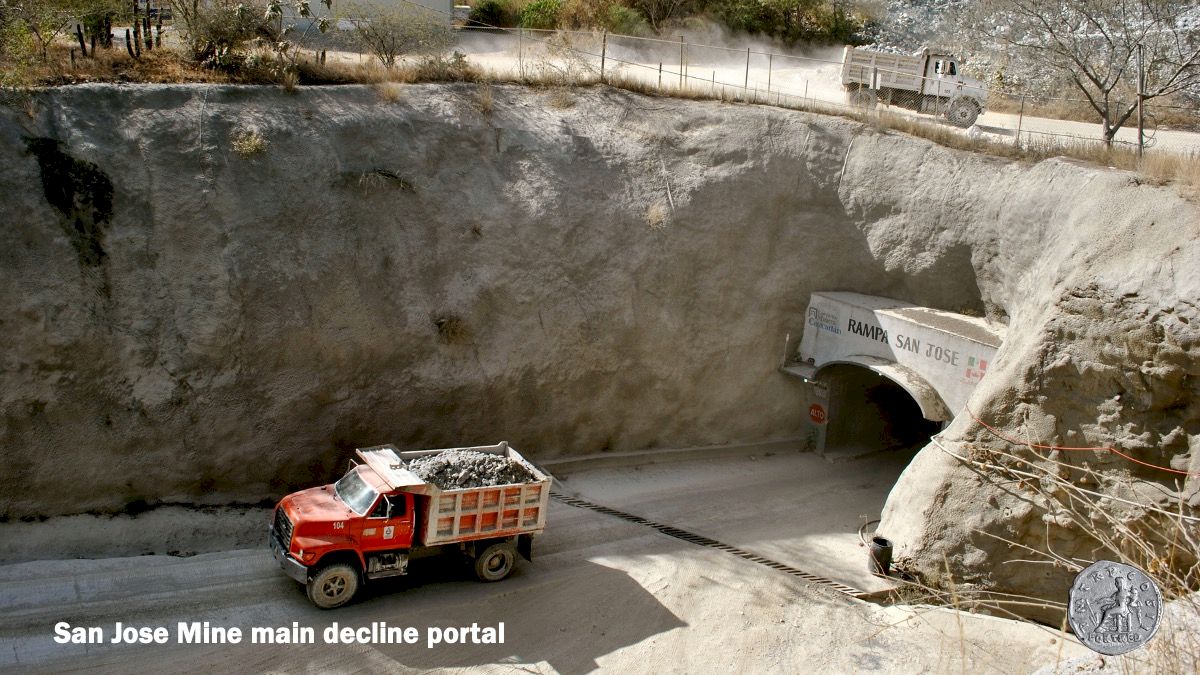
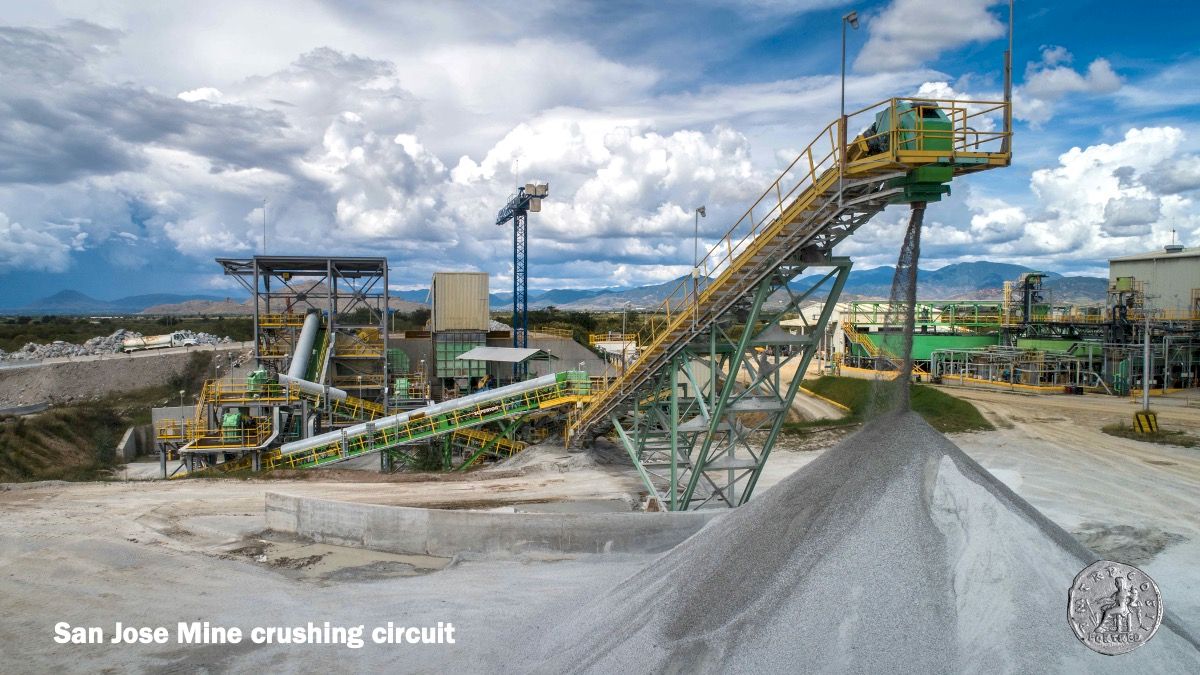
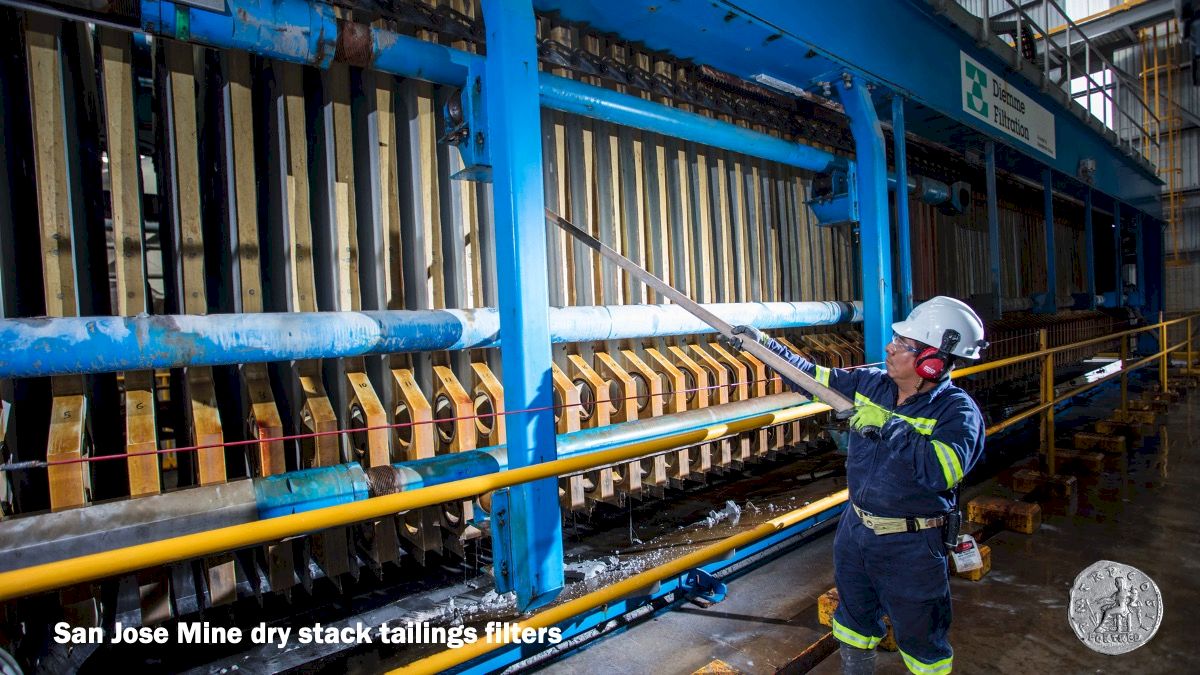
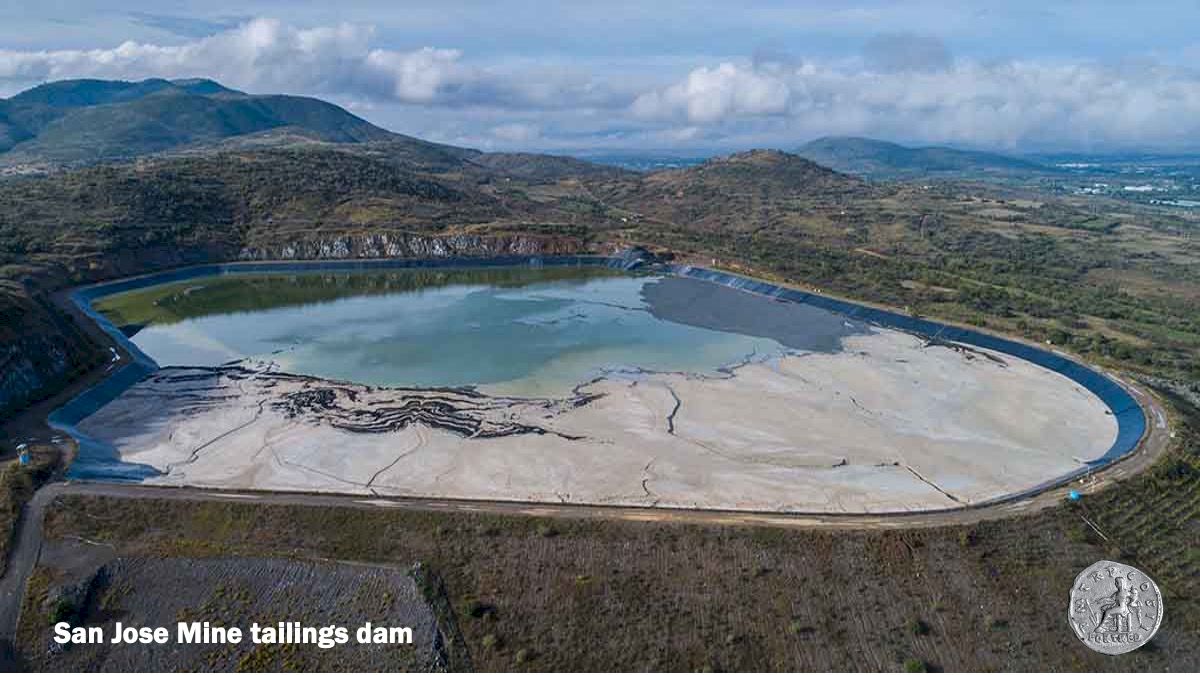
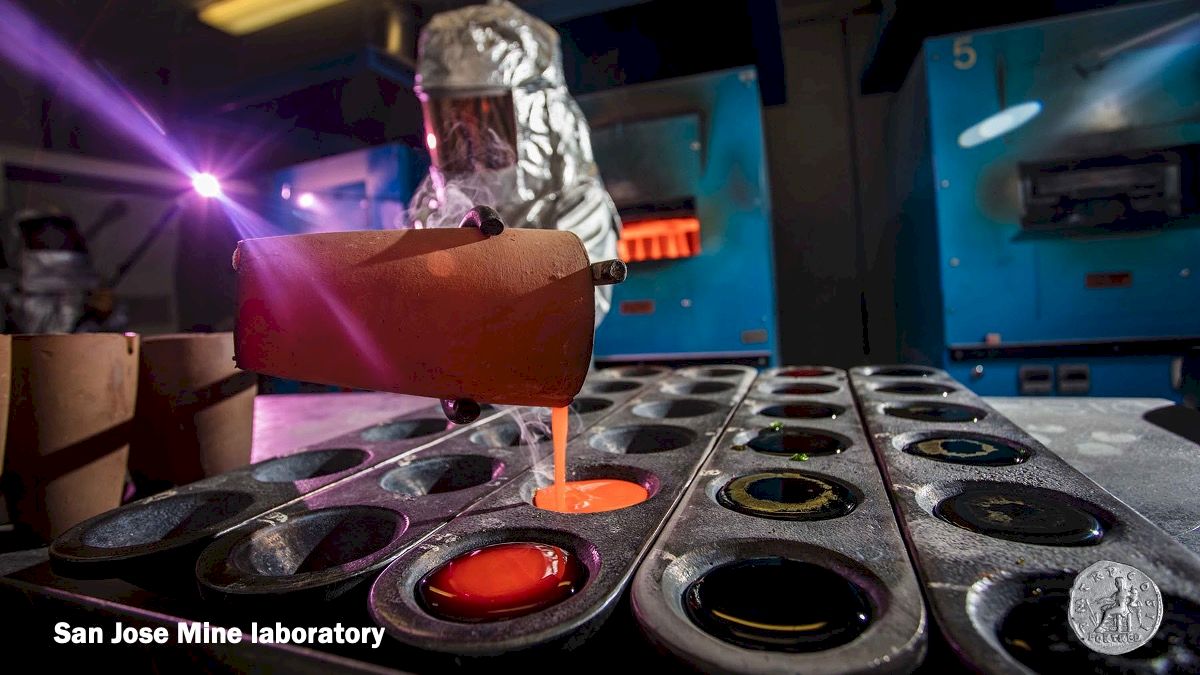
Our San Jose Mine in the Taviche Mining District, Oaxaca, Mexico, produces silver and gold. The underground mine is operated by Compañia Minera Cuzcatlan S.A. de C.V., a Mexican subsidiary 100% owned by Fortuna. It is a low sulfidation epithermal vein deposit and based on reserves reported as of December 31, 2023, the operation has a one-year mine life.
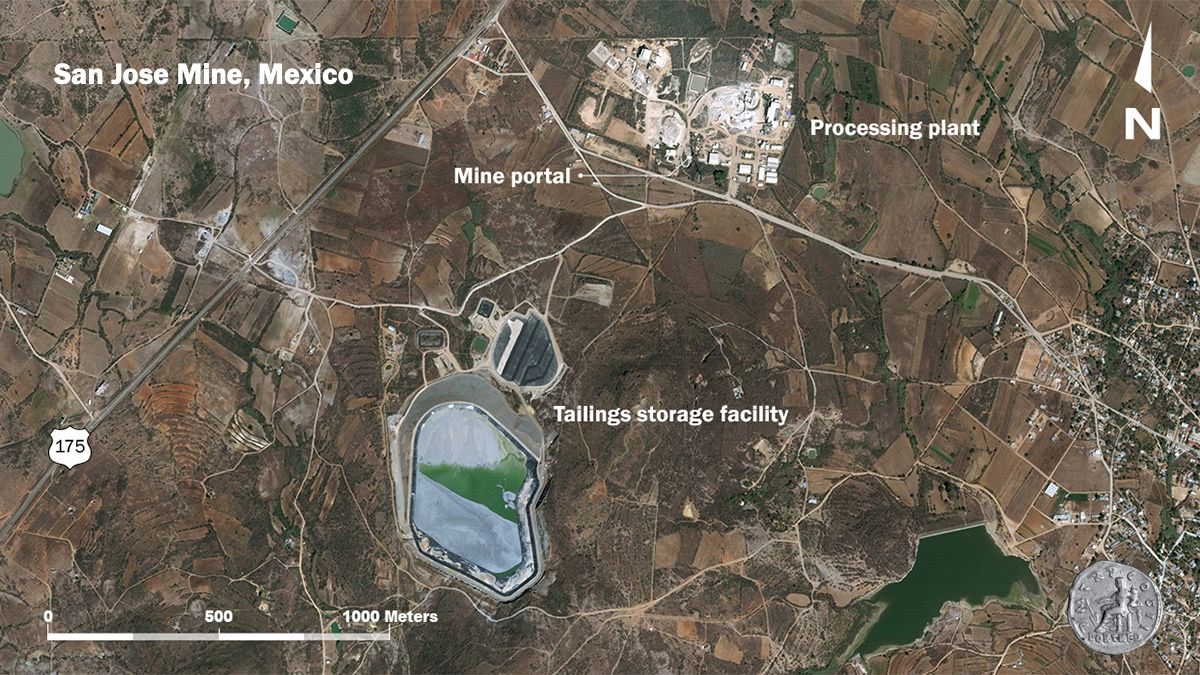
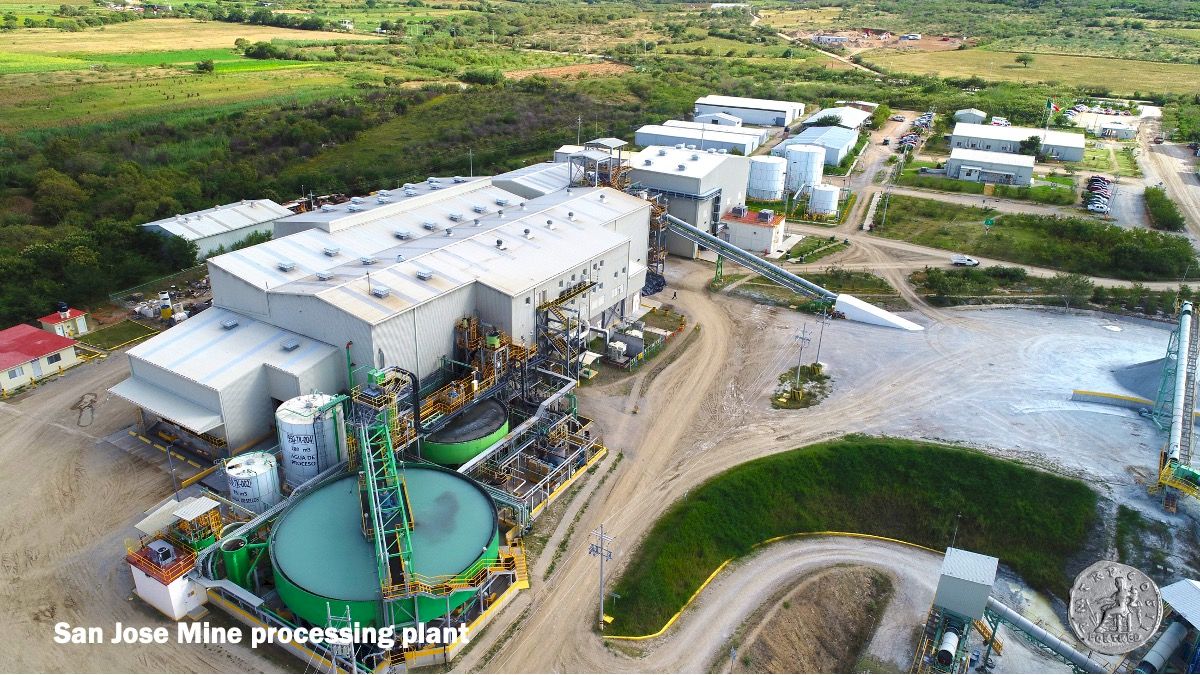
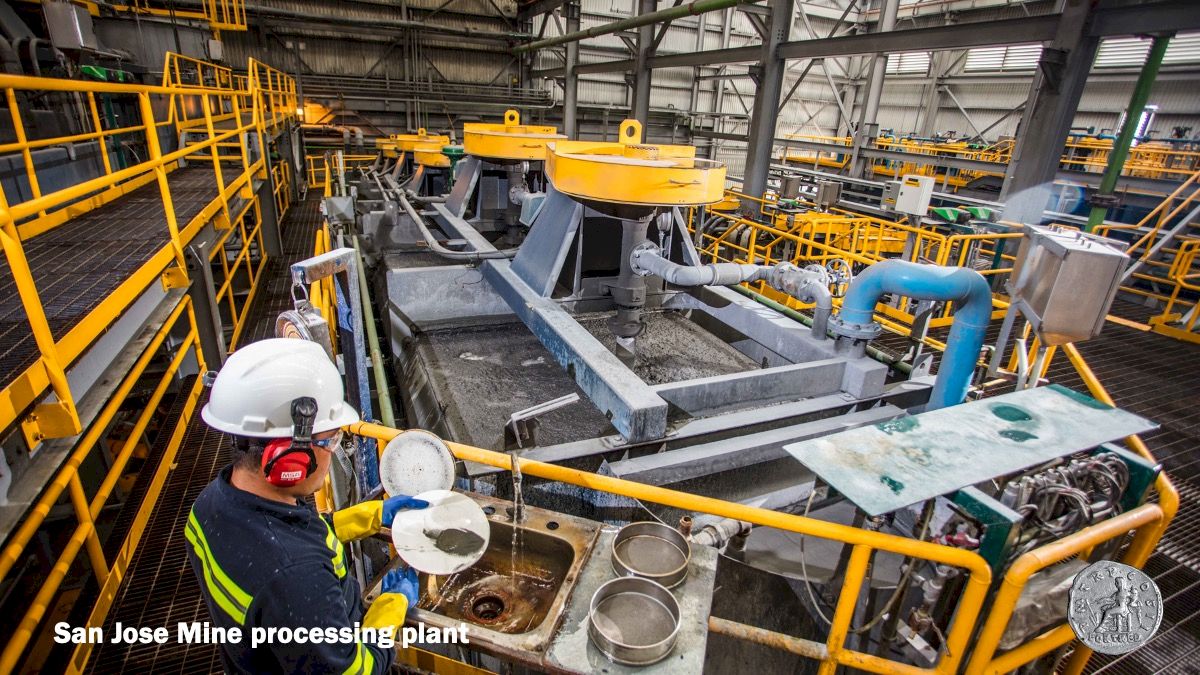
The San Jose Mine was commissioned in July 2011 and began commercial production in September 2011 at 1,000 tonnes per day. With strategic investment over many years, we increased the mill’s capacity to 3,000 tonnes per day by mid-2016. In 2023, the mine produced 4.7 million ounces of silver and 28,559 ounces of gold.
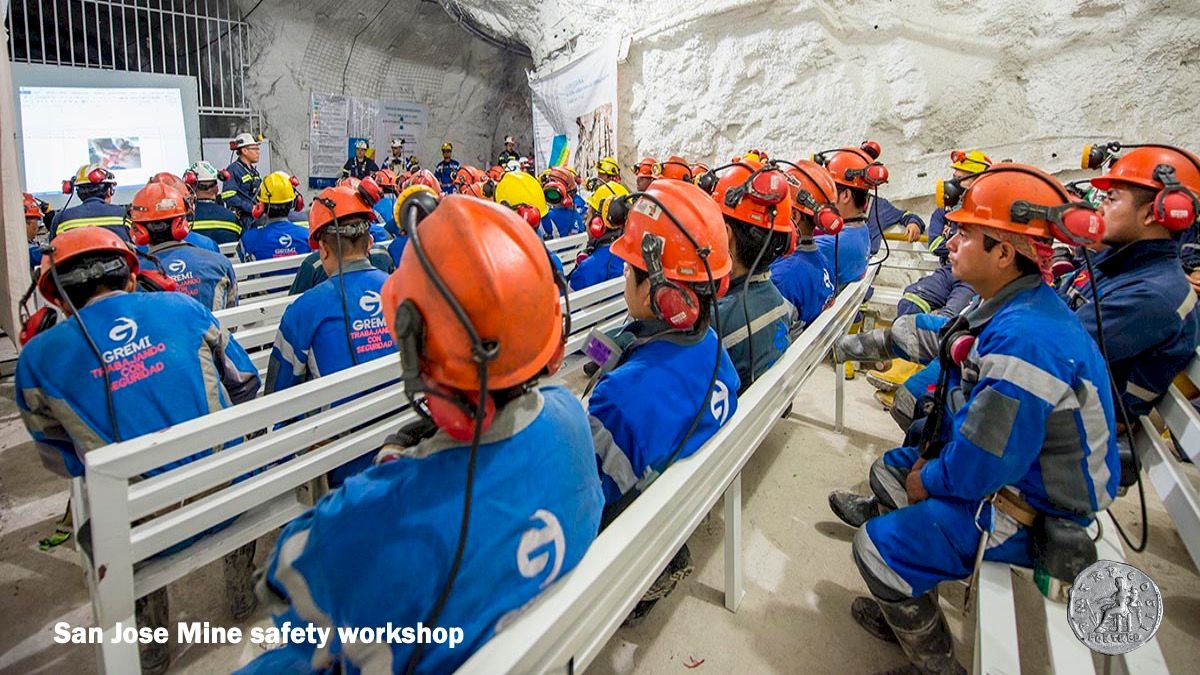
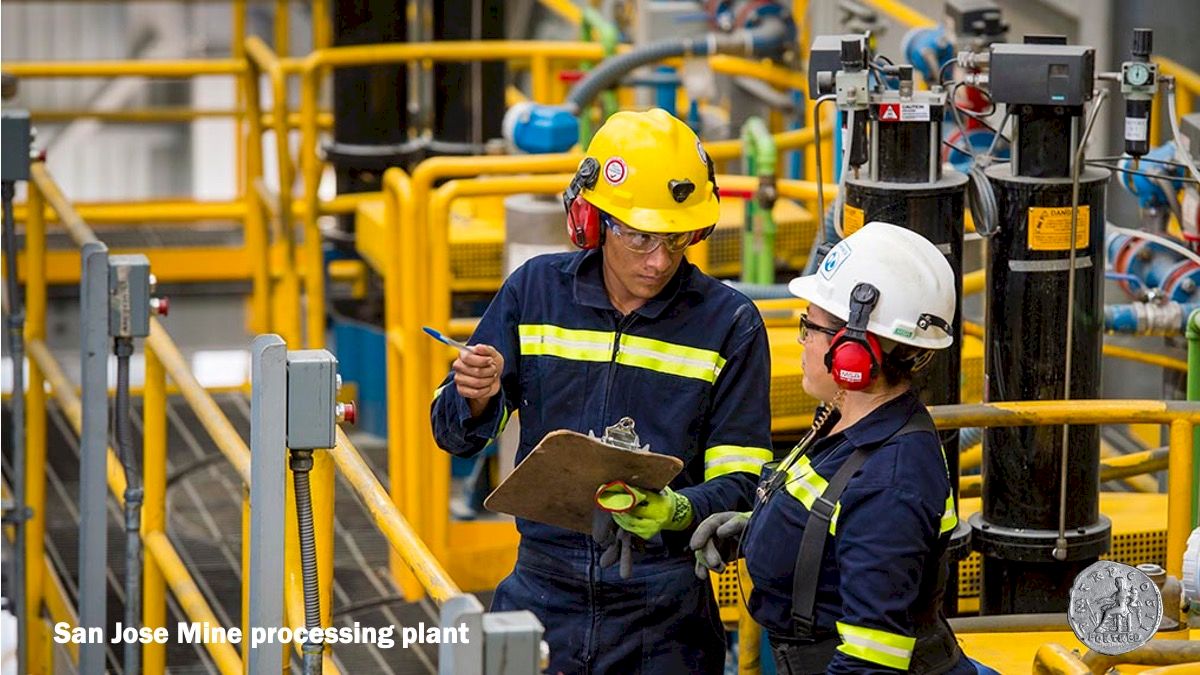
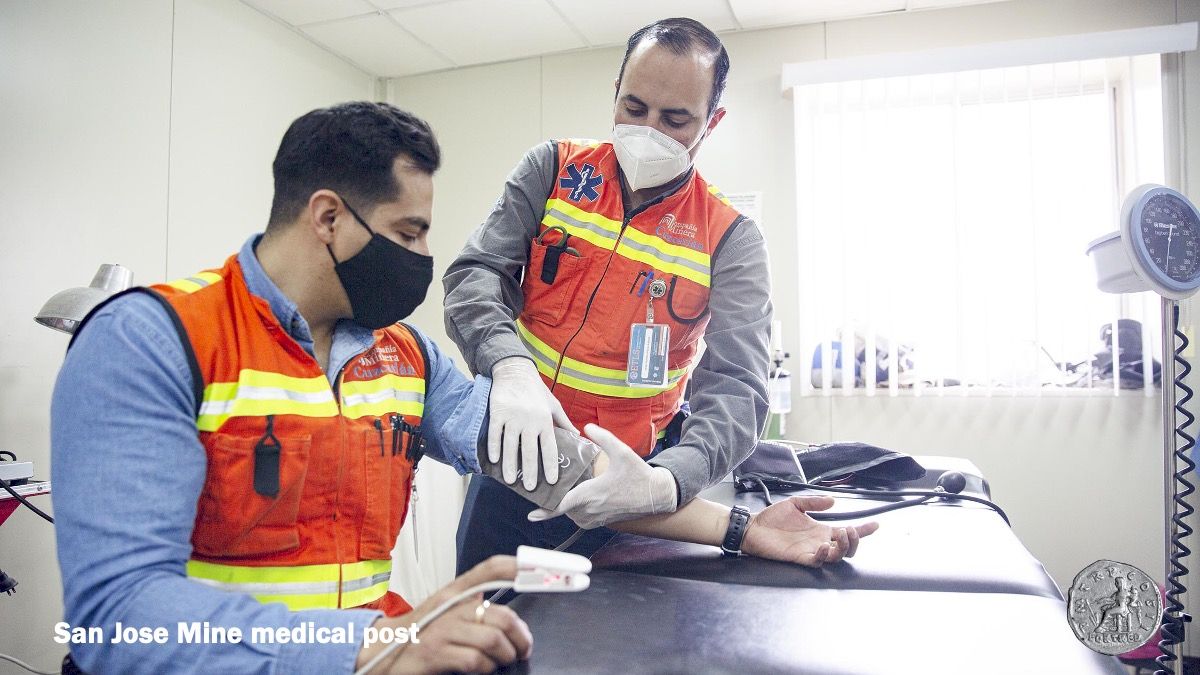
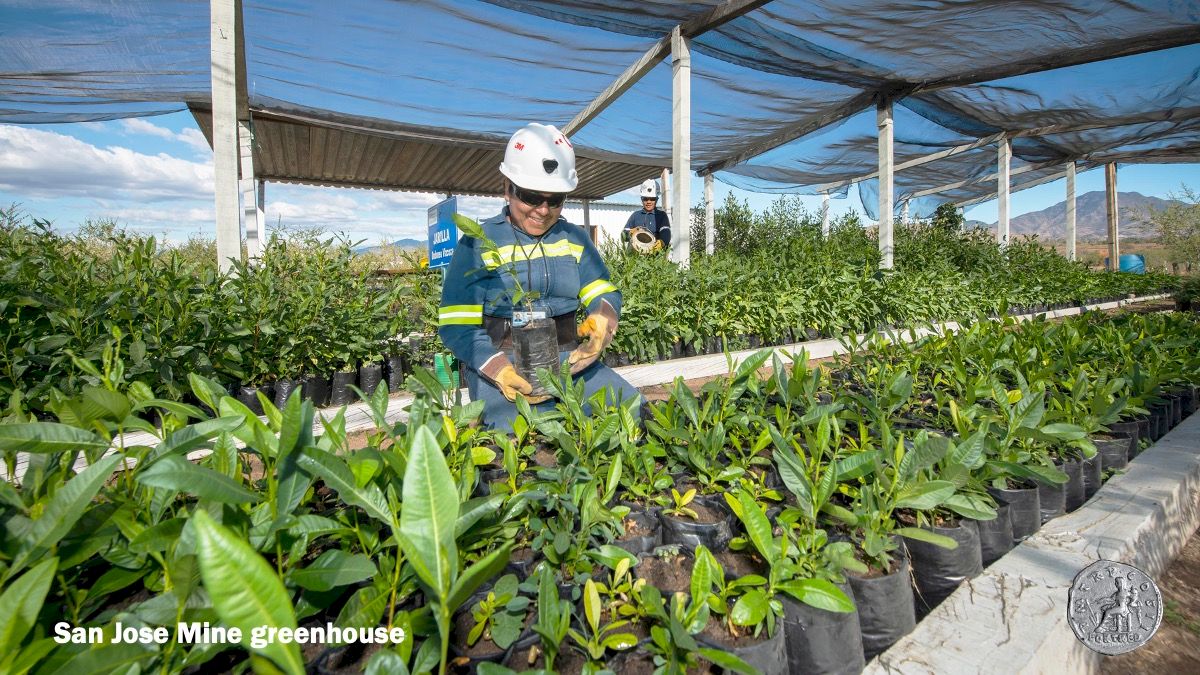
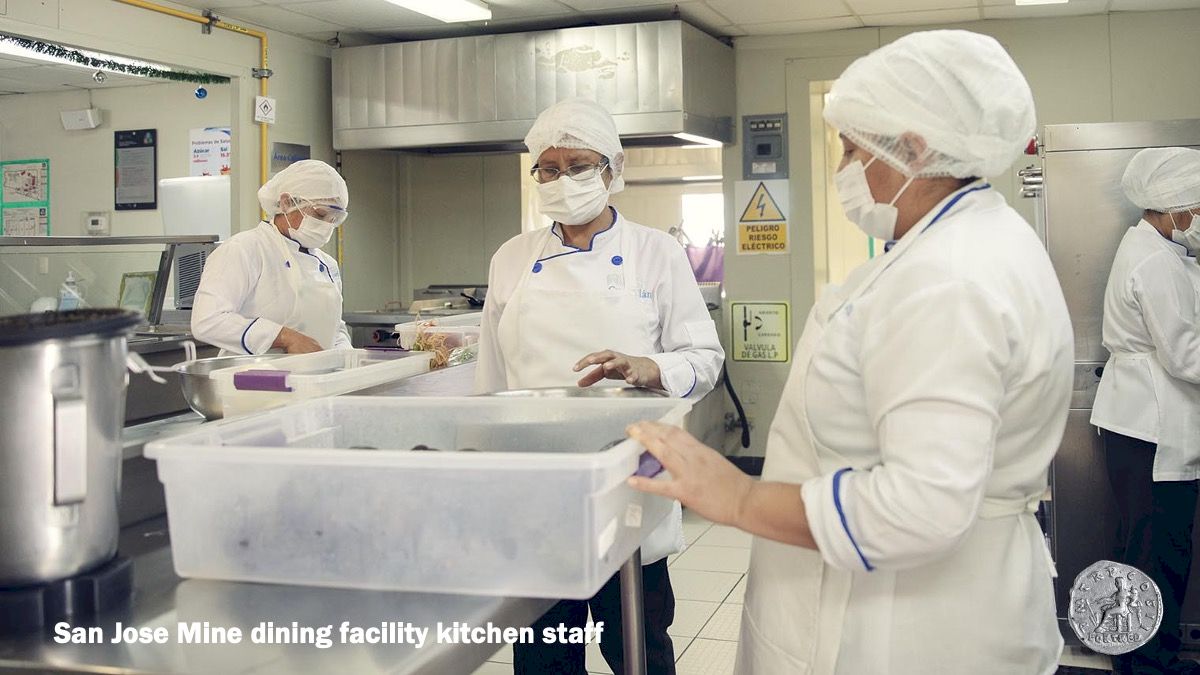
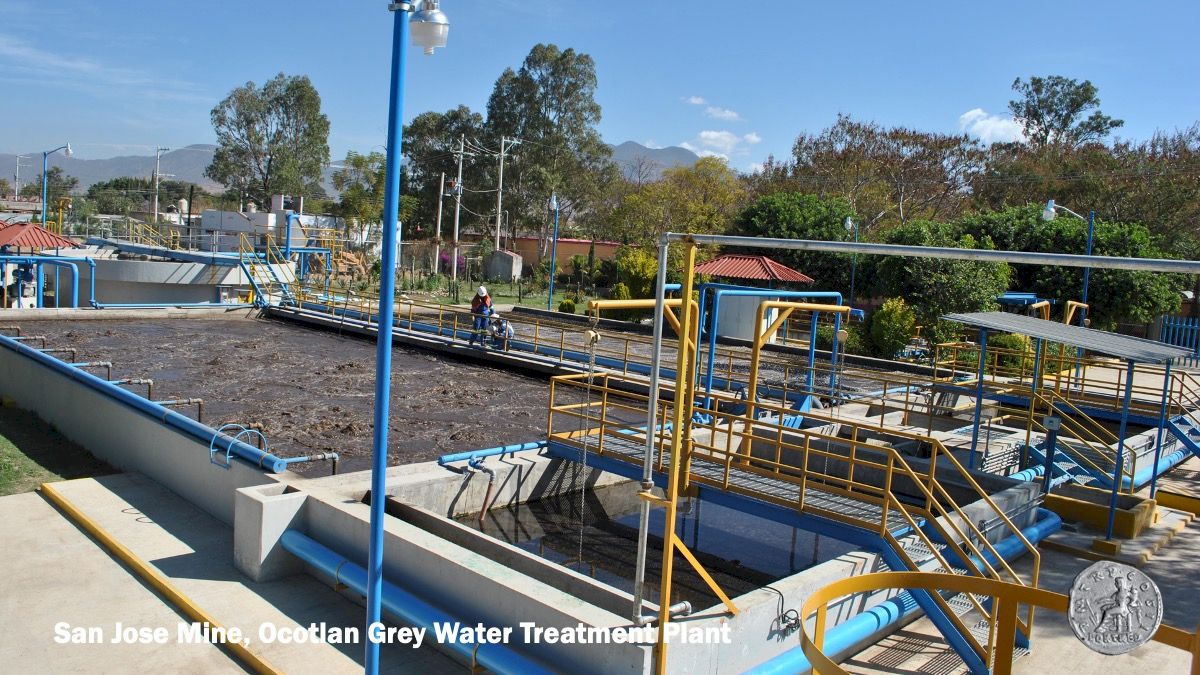
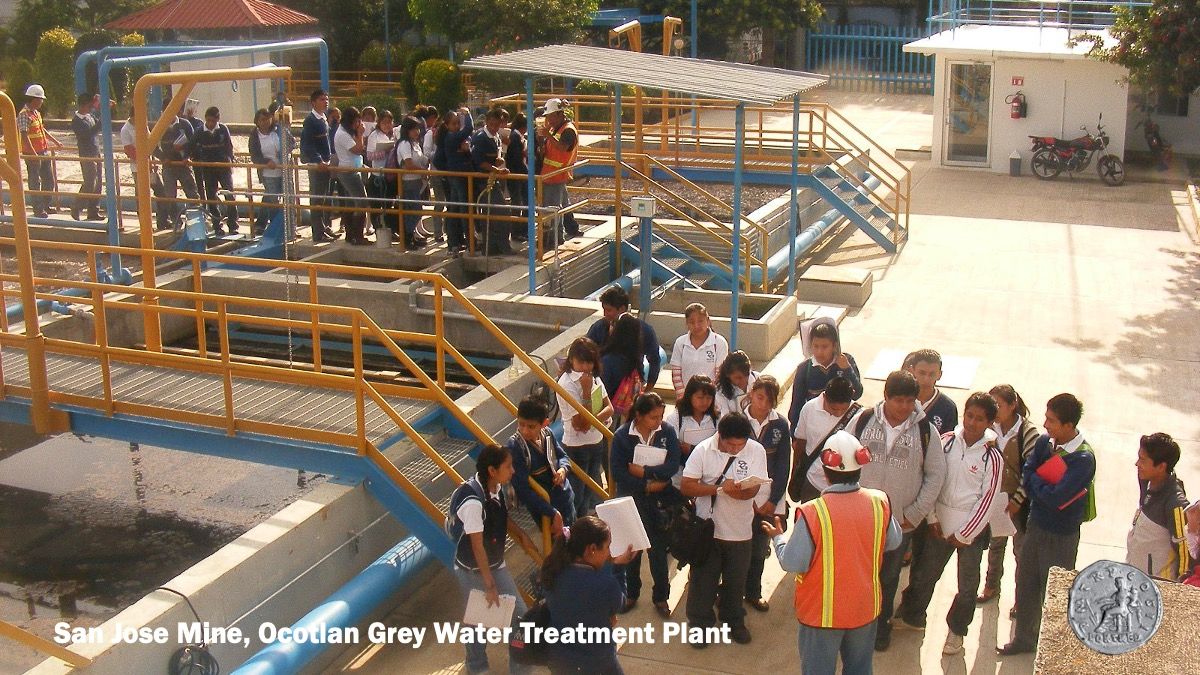
We recognize the role our San Jose Mine plays to support sustainable development in our areas of influence around the mine. As the largest employer in the area, we employed 410 local members and partnered with 70 suppliers from our local communities in 2022.
San Jose Mine Video
Share

Commodity
Silver, gold

Ownership
100%
Operation
3,000
tonnes per day

Claim block area
48,000
hectares

Deposit type
Low sulphidation
epithermal vein
deposit
epithermal vein
deposit

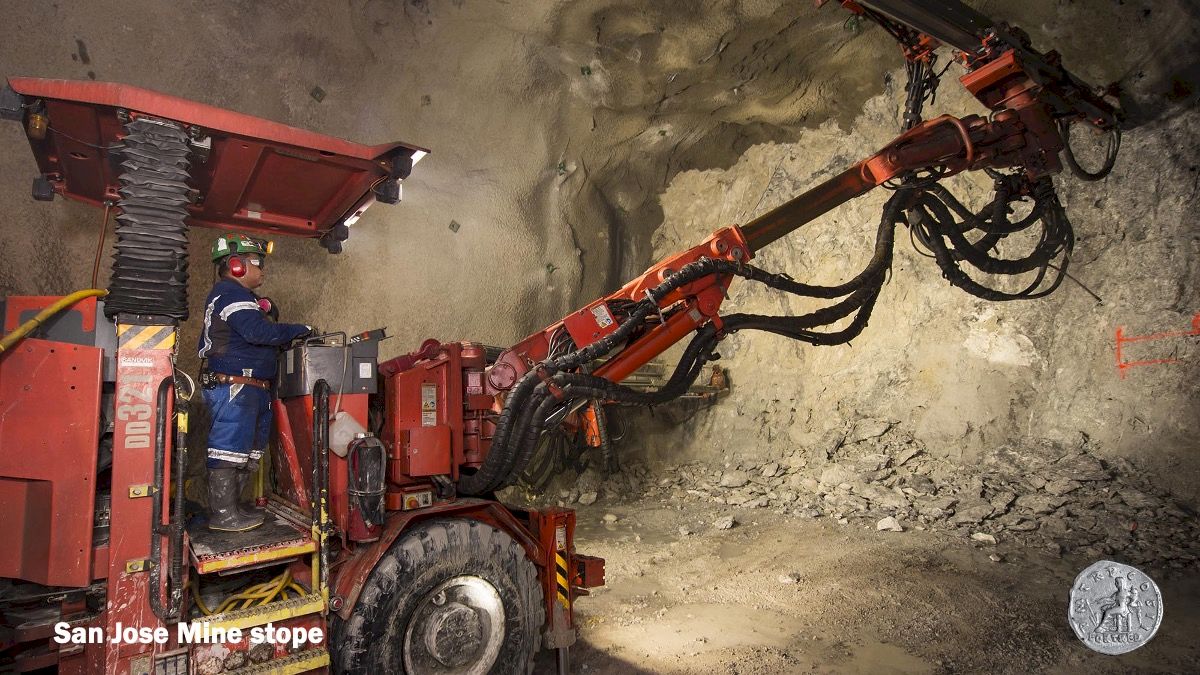
Mining method
Underground
cut-and-fill
cut-and-fill
OPERATING HIGHLIGHTS
|
20231 |
2024E1 |
|
|---|---|---|
|
Tonnes milled (000) |
930 |
900 |
|
Average milled (tpd) |
2,643 |
2,466 |
|
Silver production (Moz) |
4.7 |
3.1 - 3.6 |
|
Gold production (koz) |
28.6 |
19 - 23 |
|
AISC2,3,4 (US$/oz Ag Eq) |
$19.40 |
$22.8 - $24.0 |
Notes:
- Refer to Fortuna news releases dated January 18, 2023, "Fortuna reports record 2023 production of 452 koz Au Eq and 2024 annual guidance of 457 to 497 koz Au Eq"
- Cash Cost and all-in sustaining cost (AISC) are non-IFRS financial measures which are not standardized financial measures under the financial reporting framework used to prepare the financial statements of the Company and might not be comparable to similar financial measures disclosed by other issuers. Refer to the note under “Non-IFRS Financial Measures” on this website.
- The following table provides the historical cash costs and historical AISC for the four operating mines for the year ended December 31, 2022, as follows:
Mine Cash Costa,b,c AISCa,b,c SILVER ($/oz AgEq) ($/oz AgEq) San Jose, Mexico 10.56 15.11 Caylloma, Peru 12.34 17.97 GOLD ($/oz Au) ($/oz Au) Lindero, Argentina 740 1,142 Yaramoko, Burkina Faso 840 1,529 - (a) Cash cost and AISC are non-IFRS financial measures; refer to the note under “Non-IFRS Financial Measures” on this website.
- (b) Silver equivalent was calculated at metal prices of $1,802/oz Au, $21.75/oz Ag, $2,161/t Pb and $3,468/t Zn for the year ended December 31, 2022
- (c) Further details on the cash costs and AISC for the year ended December 31, 2022 are disclosed on pages 38, 40, and 41 (with respect to cash costs) and pages 39 and 42 (with respect to AISC) of the Company’s management discussion and analysis (“MD&A”) for the year ended December 31, 2022 dated as of March 15, 2023 (“2022 MD&A”) which is available under Fortuna's SEDAR+ profile at www.sedarplus.ca and is incorporated by reference into this news release, and the note under “Non-IFRS Financial Measures” on this website.
- Cash cost includes production cash cost. AISC includes sustaining capital expenditures, worker’s participation (as applicable) commercial and government royalties mining tax, export duties (as applicable), subsidiary G&A and Brownfields exploration and is estimated at metal prices of $1,800/oz Au, $22/oz Ag, $2,000/t Pb, and $2,500/t Zn. AISC excludes government mining royalty recognized as income tax within the scope of IAS-12.
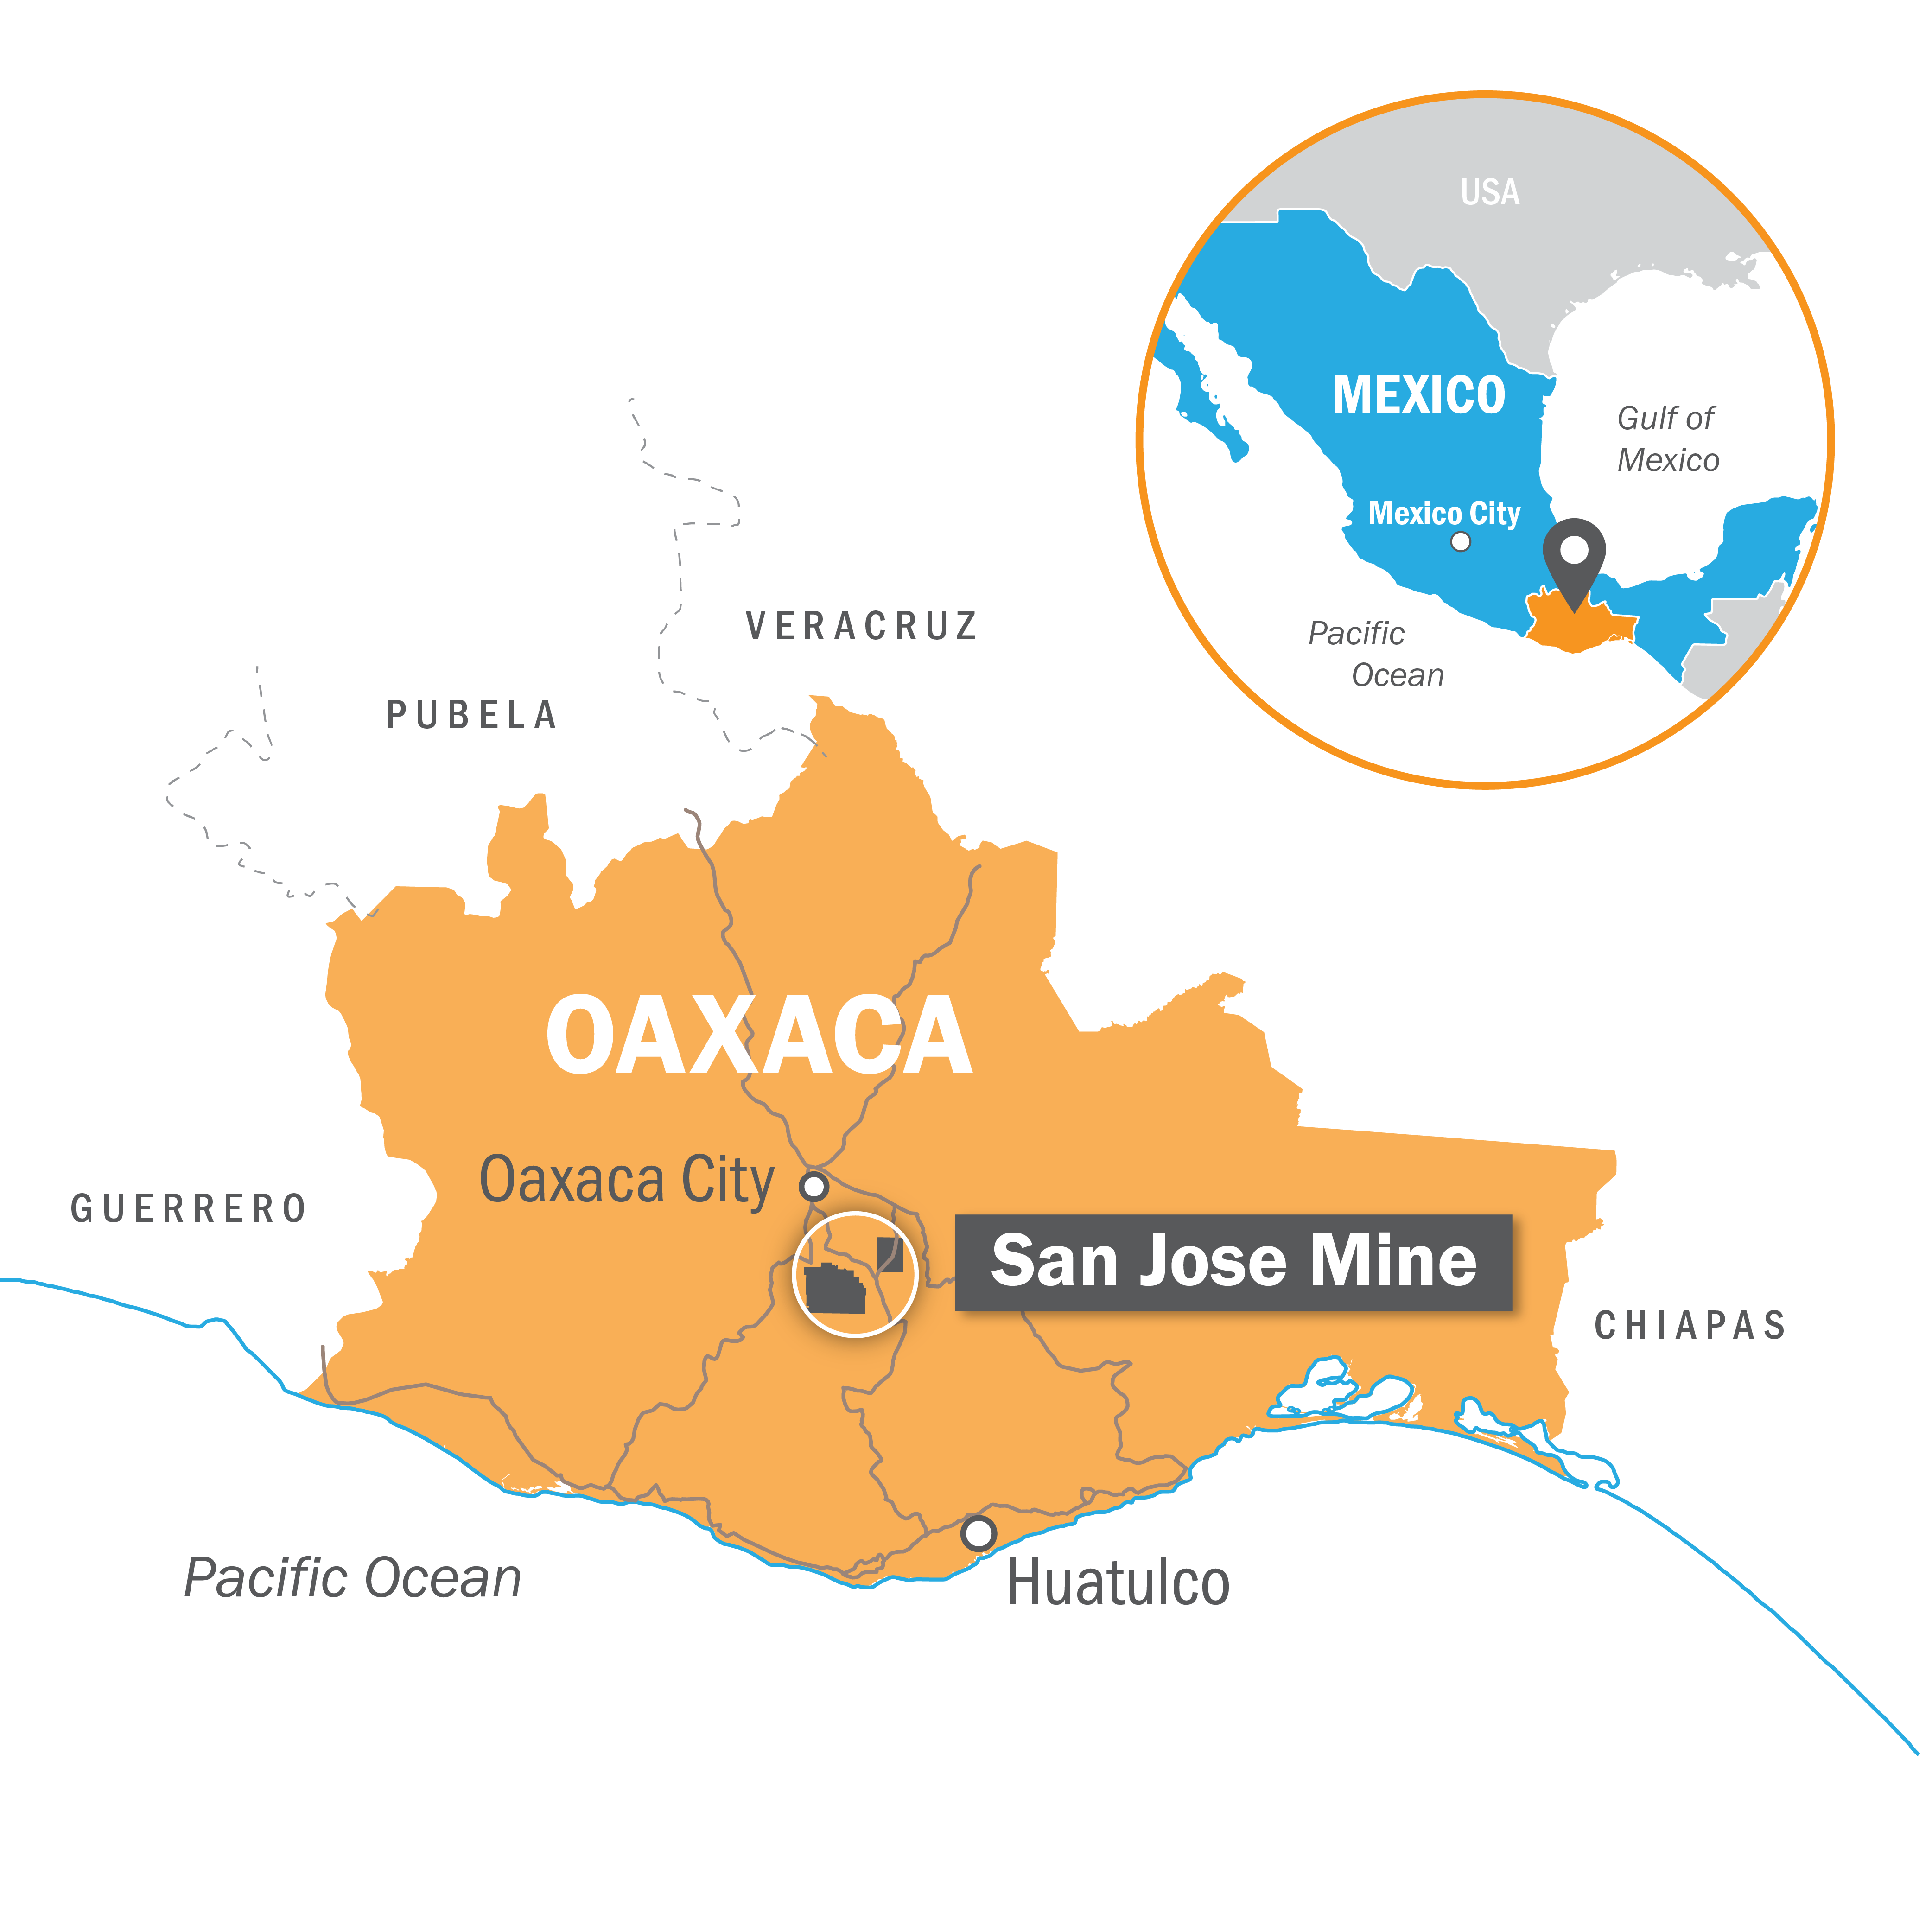
LOCATION
|
Our San Jose Mine is located in the Taviche Mining District in central Oaxaca, southern Mexico (Latitude 16° 41’ 40” N, Longitude: 96° 42’ 00” W). Mining occurs year-round. Many of our workers and suppliers come from the nearest city, Oaxaca, a 47-kilometre drive to the north, and the nearby communities of San Jose del Progreso and Ocotlán de Morelos. Oaxaca is the nearest international airport, and the mine is less than one kilometre from Federal Highway 175, the major highway between Oaxaca and Puerto Angel on the Pacific coast. |

GEOLOGY AND MINERALIZATION
The San Jose deposit is a low sulfidation epithermal vein system characterized by mineralized multiphase quartz-carbonate-sulphide veins, hydrothermal breccias and stockwork veining. The mineralized system is hosted in a sequence of Tertiary andesitic volcanic and volcaniclastic rocks.
MINERAL RESERVES
2.1 million tonnes
averaging 172 g/t Ag and 1.16 g/t Au containing 11.8 Moz Ag and 80 koz Au
Refer to Mineral Reserves and Resources table below for full disclosure
BROWNFIELDS EXPLORATION
The Brownfields exploration program budget for 2024 at San Jose is $4.9 million, which includes 13,900 meters of diamond drilling, focused on testing and extending the Yessi vein as well as exploring additional targets within the mine area.
Mineral Reserves and Resources
|
Mineral Reserves - Proven and Probable |
Contained Metal |
|||||
|---|---|---|---|---|---|---|
|
Property |
Classification |
Tonnes (000) |
Ag (g/t) |
Au (g/t) |
Ag (Moz) |
Au (koz) |
|
San Jose, Mexico |
Proven |
37 |
172 | 1.23 | 0.2 | 2 |
|
Probable |
695 | 155 | 0.97 | 3.5 | 22 | |
|
Proven + Probable |
733 | 156 | 0.98 | 3.7 | 23 | |
|
Mineral Resources - Measured and Indicated |
Contained Metal |
|||||
|---|---|---|---|---|---|---|
|
Property |
Classification |
Tonnes (000) |
Ag (g/t) |
Au (g/t) |
Ag (Moz) |
Au (koz) |
|
San Jose, Mexico |
Measured |
45 |
141 | 1.09 | 0.2 | 2 |
|
Indicated |
1,001 | 148 | 1.11 | 4.7 | 36 | |
|
Measured + Indicated |
1,046 | 147 | 1.11 | 5.0 | 37 | |
|
Mineral Resources - Inferred |
Contained Metal |
|||||
|---|---|---|---|---|---|---|
|
Property |
Classification |
Tonnes (000) |
Ag (g/t) |
Au (g/t) |
Ag (Moz) |
Au (koz) |
|
San Jose, Mexico |
Inferred |
1,029 |
147 |
1.04 |
4.9 |
35 |
-
Notes:
- Mineral Reserves and Mineral Resources are as defined by the 2014 CIM Definition Standards for Mineral Resources and Mineral Reserves
- Mineral Resources are exclusive of Mineral Reserves
- Mineral Resources that are not Mineral Reserves do not have demonstrated economic viability
- Factors that could materially affect the reported Mineral Resources or Mineral Reserves include; changes in metal price and exchange rate assumptions; changes in local interpretations of mineralization; changes to assumed metallurgical recoveries, mining dilution and recovery; and assumptions as to the continued ability to access the site, retain mineral and surface rights titles, maintain environmental and other regulatory permits, and maintain the social license to operate
- San Jose Mineral Resources and Reserves are reported as of December 31, 2023
- Mineral Reserves for the San Jose Mine are based on underground mining within optimized stope designs using an estimated NSR break-even cut-off grade of $96.54/t to $85.02/t equivalent to 154 to 132 g/t Ag Eq based on assumed metal prices of $23.90/oz Ag and $1,880/oz Au; estimated metallurgical recovery rates of 91 % for Ag and 90 % for Au and mining costs of $49.83/t (C&F) - $38.31/t (SLS); processing costs of $20.79/t; and other costs including distribution, general service costs of $25.92/t based on actual operating costs. Average mining recovery is estimated to 94 % (C&F) and 92 % (SLS) and average mining dilution 10 % (C&F) and 14 % (SLS). Mineral Resources are reported at a 130 g/t Ag Eq cut-off grade based on the same parameters used for Mineral Reserves
- Eric Chapman, P. Geo. (EGBC #36328) is the Qualified Person for resources and Raul Espinoza (FAUSIMM (CP) #309581) is the Qualified Person for reserves, both being employees of Fortuna Silver Mines Inc.
- Totals may not add due to rounding procedures
Maps and Sections
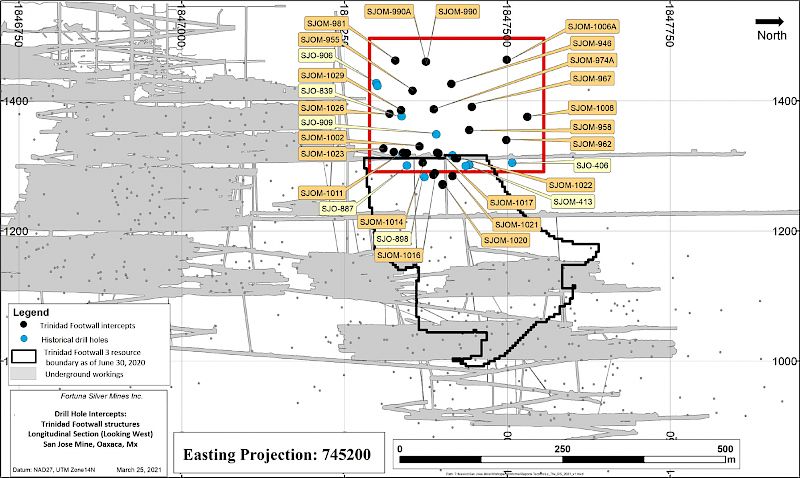
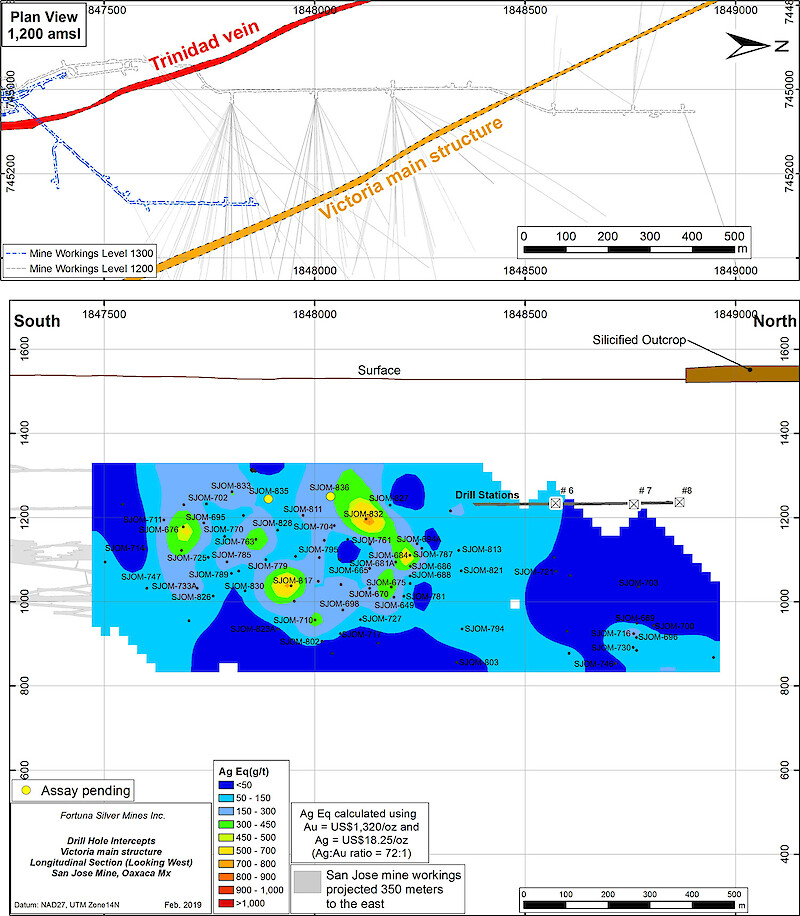

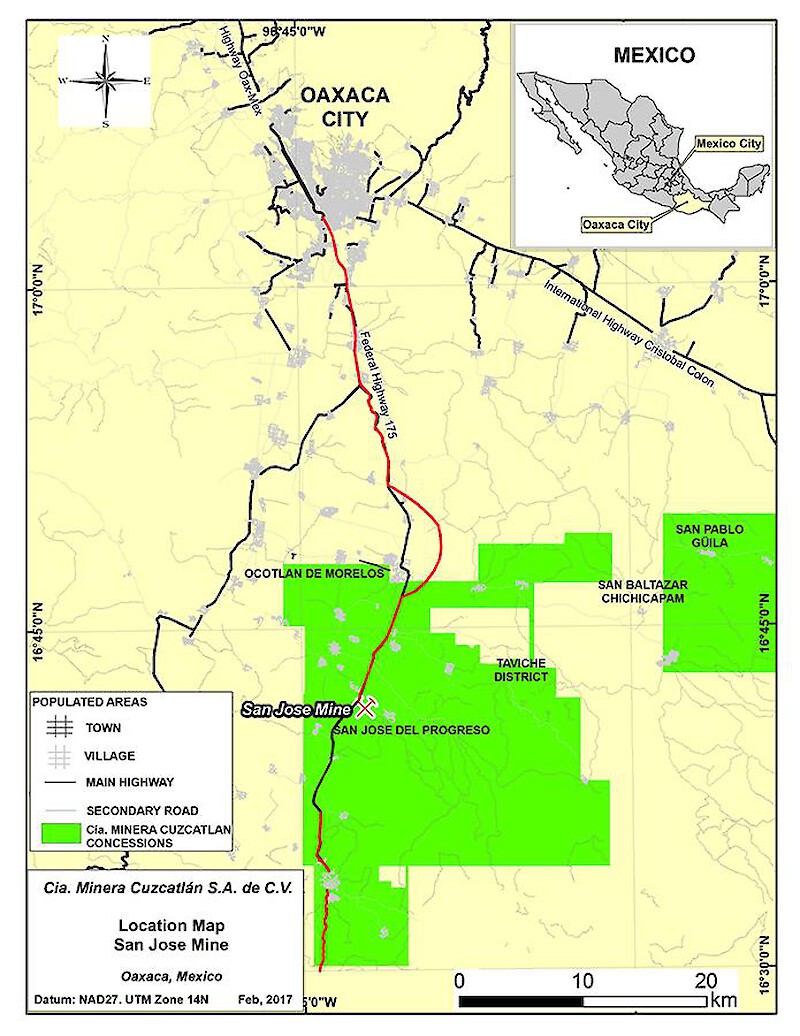
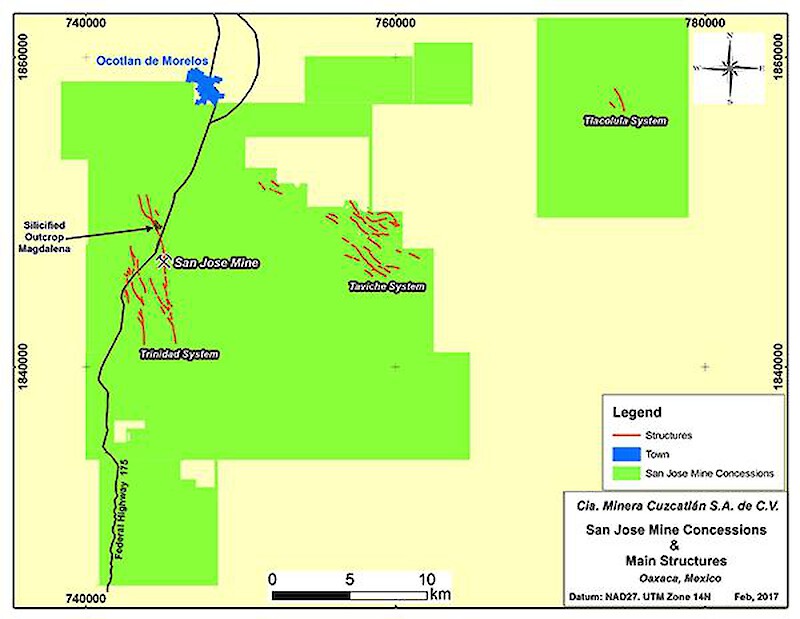
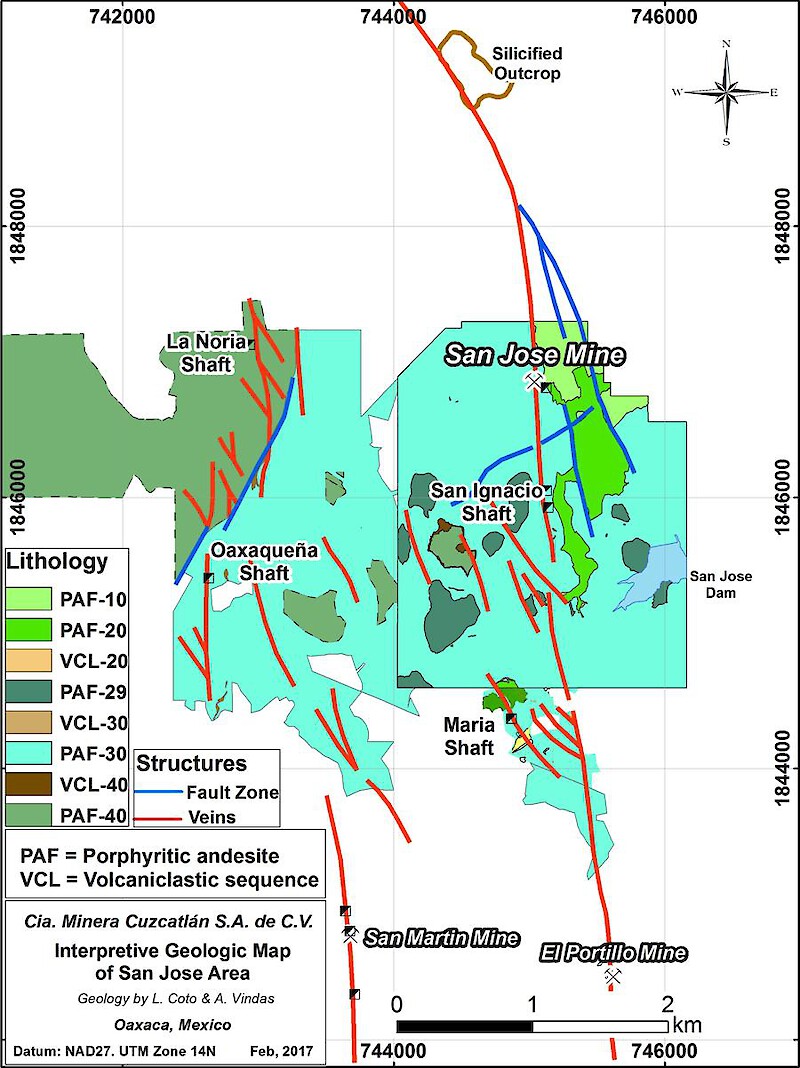
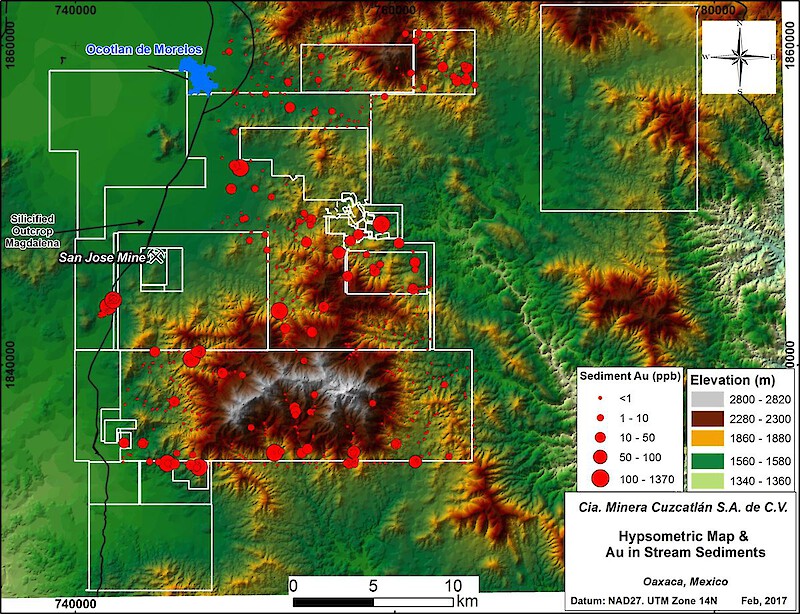
Photo Gallery
Corporate Video - A global intermediate gold and silver producer
Share


Stay Connected
Sign Up for Email Updates
Register to receive news via email from Fortuna Silver Mines Inc.
* Required Fields