Fortuna reports results for the second quarter of 2023
August 9, 2023 06:30 PM PDT
(All amounts are expressed in US dollars, tabular amounts in millions, unless otherwise stated)
Vancouver, August 9, 2023: Fortuna Silver Mines Inc. (NYSE: FSM) (TSX: FVI) ("Fortuna" or the "Company") today reported its financial and operating results for the second quarter of 2023.
Second Quarter 2023 highlights
Financial
- Adjusted net income of $2.9 million or $0.01 per share
- Net income of $3.5 million or $0.01 per share
- Adjusted EBITDA1 of $44.4 million
- Net cash provided by operating activities $44.2 million and free cash flow from ongoing operations of $9.5 million
- Liquidity as of March 31, 2023 was $97.9 million
Return to Shareholders
- NCIB share repurchase program renewed for up to 5% of outstanding common shares (refer to Fortuna news release dated April 28, 2023)
Operational
- Gold production of 64,348 ounces
- Silver production of 1,262,561 ounces
- Gold equivalent production of 93,454 ounces
- Consolidated cash costs1 per ounce of gold equivalent sold of $968
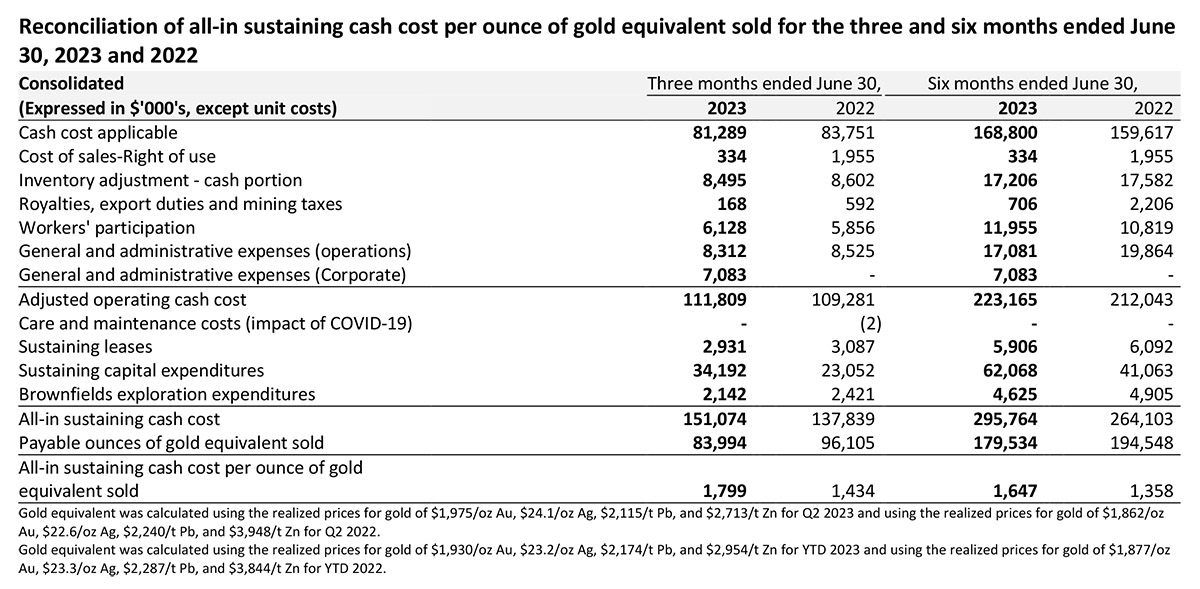
- Consolidated all-in sustaining costs (AISC)1 per ounce of gold equivalent sold of $1,799
- Lost Time Injury Frequency Rate (LTIFR) of 0.43 and Total Recordable Injury Frequency Rate (TRIFR) of 1.15. One fatal incident was recorded at the Caylloma mine in June.
Growth and Development
- First gold pour at the Séguéla mine in Côte d’Ivoire took place on May 24, 2023, with the first gold shipment having taken place in July, subsequent to the close of the quarter.
- The transaction to acquire Chesser Resources Limited is continuing to progress and is expected to close in the third week of September
Jorge A. Ganoza, President and CEO, commented, "The first gold pour and sale at Séguéla is an exciting milestone for the Company as our new flagship asset enters into production and adds stable, high margin ounces to our portfolio. Ramp-up activities at the process plant continue to progress, and during the month of July the process plant met and exceeded name plate capacity and is expected to operate at a stable rate through the quarter."
Mr. Ganoza continued, "Loss of production, stand-by charges and expenses related to the illegal union blockade at the San Jose Mine and standby charges during the repair of the Armtec tunnel at the Yaramoko Mine, both weighed on the results and AISC for the second quarter. Despite these headwinds the Company generated positive free cash flow from ongoing operations of $9.5 million. At Séguéla, although we produced over four thousand ounces in the days prior to quarter end, ahead of schedule, the first gold sale did not take place until early in the third quarter."
Mr. Ganoza concluded "With Séguéla contributing its first full quarter of production in the third quarter, the return of normal to operations at San Jose, Yaramoko continuing to perform above expectations, and the completion of a stripping phase in the second quarter at Lindero, we expect growing margins and free cash flow to improve in the third and fourth quarter of the year".
Second Quarter 2023 Consolidated Results
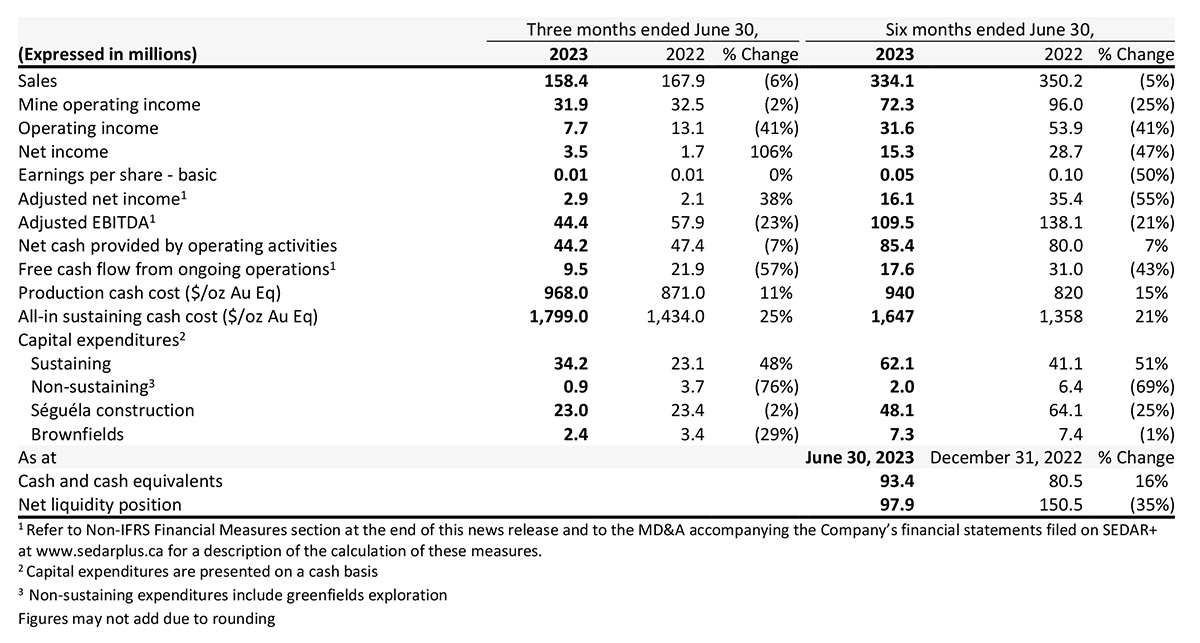
1 Refer to Non-IFRS Financial Measures section at the end of this news release and to the MD&A accompanying the Company’s financial statements filed on SEDAR+ at www.sedarplus.ca for a description of the calculation of these measures.
2 Capital expenditures are presented on a cash basis
3 Non-sustaining expenditures include greenfields exploration
Figures may not add due to rounding
Second Quarter 2023 Results
Net income for the quarter was $3.5 million compared to $1.7 million in Q2 2022. After adjusting for non-cash and non-recurring items, adjusted net income for the quarter was $2.9 million compared to $2.1 million in Q2 2022. The slight increase in adjusted net income is explained by lower income taxes and effective tax rate in Q2 2023, compensating for a reduction in operating income of $5.4 million compared to Q2 222. The reduction in operating income was due mainly to lower volume of metal sold at San Jose due to the 15-day stoppage related to an illegal blockade at the mine, and lower volume at Lindero related to the mine sequence. This impact was combined with higher cash cost of sales per gold equivalent ounce mainly due to lower production rates and head grades at San Jose associated with the ramp-up process following the work stoppage at the mine, and higher input costs and lower head grades at Lindero. These effects were partially offset by lower cost of sales per ounce of gold at Yaramoko. Operating income was further impacted by $7.3 million of non-recurring expenses comprised of $3.5 million of stand-by charges at San Jose and Yaramoko, $2.8 million related to a new agreement with the workers´ union at San Jose, and a $1.0 million administrative penalty at Yaramoko payable to the Ministry of Mines. The positive impact of higher gold and silver prices in Q2 2023 was offset by a sharp drop in zinc prices. The realized gold and silver price were $1,974 per ounce and $24.10 per ounce, respectively, in Q2 2023, compared to $1,870 and $22.62, respectively in Q2 2022.
Adjusted EBITDA for the quarter was $44.4 million, representing a margin of 28% over sales, compared to $57.9 million reported in the same period in 2022, representing a margin of 34% over sales. The main drivers for the decrease in adjusted EBITDA were lower volume sold, non-recurrent items, and higher costs per gold equivalent ounce as described above.
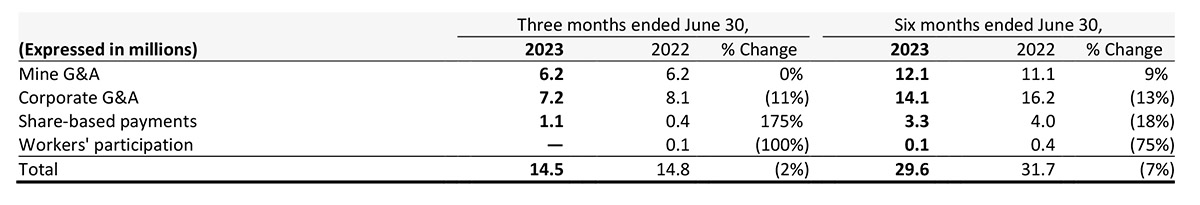
General and administrative expenses for the quarter of $14.5 million were in line with the same period in 2022. G&A is comprised of the following items:
Net cash generated by operations for the quarter decreased $3.2 to $44.2 million from $47.4 million in Q2 2022. The decrease reflects lower EBITDA of $13.5 million partially offset by $7.4 million in positive changes in working capital and income tax paid. Net cash generated by operations per share was $0.15 compared to $0.16 in Q2 2022.
In the second quarter of 2023 the Company invested $73.2 million in capital expenditures consisting primarily of $35.6 million in sustaining capital to support underground development, capitalized stripping and other projects at our operating sites, $19.5 million in construction and pre-production activities at Séguéla, $3.4 million of capitalized interest, a $10.0 million payment to Newcrest related to first gold at Séguéla and $4.5 million in costs related to the Chesser transaction.
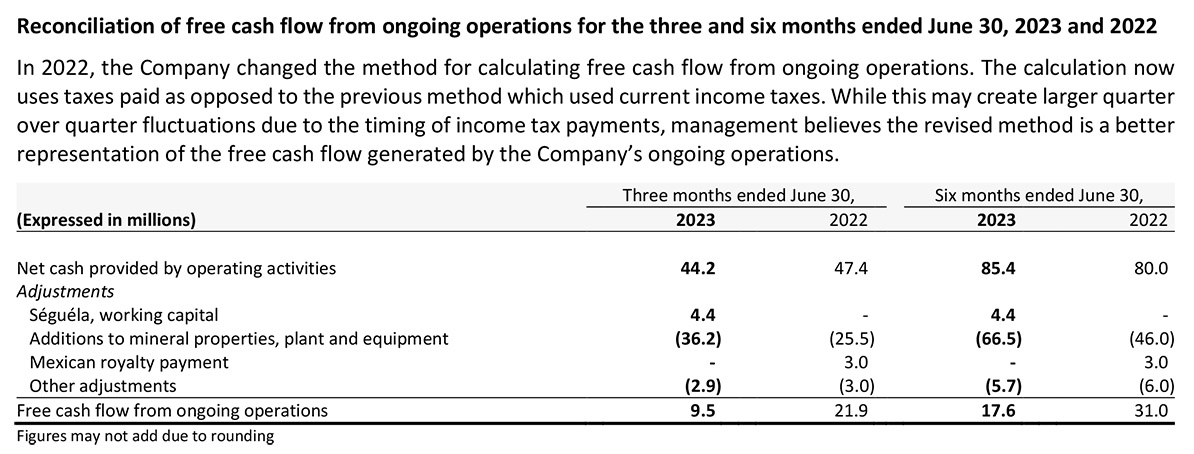
Free cash flow from ongoing operations for the quarter was $9.5 million, compared to $21.9 million in Q2 2022. The decrease of $12.4 million is the result of lower net cash generated by operations of $3.2 million and higher sustaining capex and brownfields exploration at our operating mines of $10.8 million in Q2 2023.
Consolidated All-in Sustaining Cost
Consolidated AISC per gold equivalent ounce (GEO) sold for the second quarter of 2023 was $1,799 per ounce compared to $1,434 per ounce for the comparable quarter in 2022. The increase in AISC was primarily the result of lower gold equivalent ounces sold due to the impact of the illegal blockade at the San Jose Mine, higher sustaining capital related to Phase 2 of the leach pad expansion and higher capitalized stripping at Lindero, higher underground development at Yaramoko, $7.3 million in stand-by, and one-time payments from the work stoppage at San Jose and the stoppage of underground mining at Yaramoko, and higher costs of sales per ounce at Lindero related to lower production and higher input costs.
Liquidity
The Company’s total liquidity available as of June 30, 2023 was $97.9 million, comprised of $93.4 million in cash and cash equivalents, and $4.5 million undrawn on the $250.0 million revolving credit facility.
Séguéla Gold Mine Construction Update
For the second quarter of 2023 the Company incurred and expended $8.6 million and $8.9 million respectively related to construction activities. Since the project early works began in the third quarter of 2021 the Company has incurred and expended $173.6 million and $161.2 million respectively.
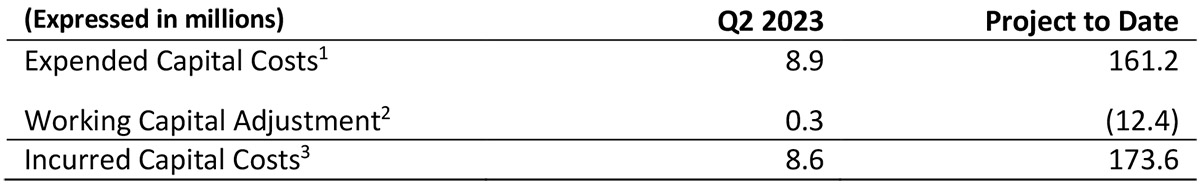
1 Cash basis. Excludes exploration costs, capitalized interest and management fees.
2 Primarily consists of work performed not yet invoiced and increases in the accounts payable balance offset by increases in the VAT receivable balance.
3 Accrual basis. Excludes capitalized interest and management fees.
4 YTD includes a correction for the timing of payments. This has not impacted project to date spend.
As of June 30, 2023 the construction of the mine was substantially complete with minimal remaining spend associated with final commissioning and vendor testing. The project was delivered on budget. Settlement of final construction related payables is expected to be financed by free cash flow from ongoing operations.
Lindero Mine, Argentina
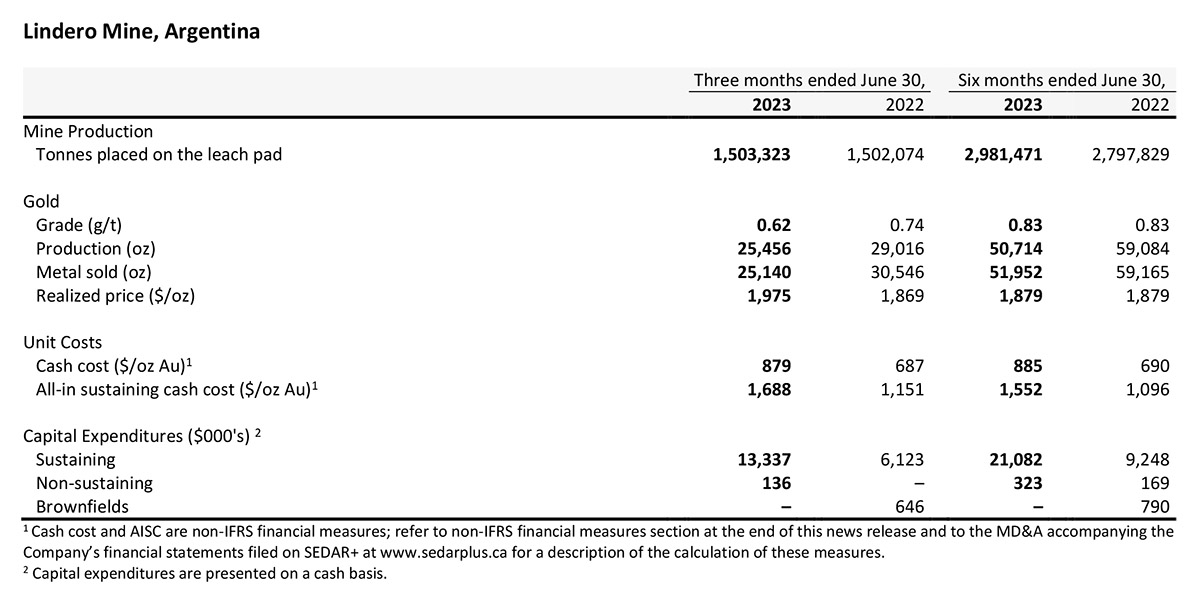
1 Cash cost and AISC are non-IFRS financial measures; refer to non-IFRS financial measures section at the end of this news release and to the MD&A accompanying the Company’s financial statements filed on SEDAR+ at www.sedarplus.ca for a description of the calculation of these measures.
2 Capital expenditures are presented on a cash basis.
Quarterly Operating and Financial Highlights
In the second quarter of 2023, a total of 1,503,323 tonnes of ore were placed on the heap leach pad, with an average gold grade of 0.62 g/t, containing an estimated 29,984 ounces of gold. Gold production for Q2 2023 totaled 25,456 ounces, comprised of 24,599 ounces of doré, an estimated 731 ounces of gold contained in fine carbon, and 126 ounces contained in copper concentrate. This represents a 12% decrease in total ounces, year-over-year. This decline in gold production can primarily be attributed to a decrease in the head grade of mineralized material placed on the leach pad, but is in line with the planned mining sequence. Mine production for the quarter was 0.8 million tonnes of mineralized material, with a strip ratio of 2.69:1. This stripping ratio is consistent with the operation's plan for the year, which anticipates a ratio of 1.17:1.
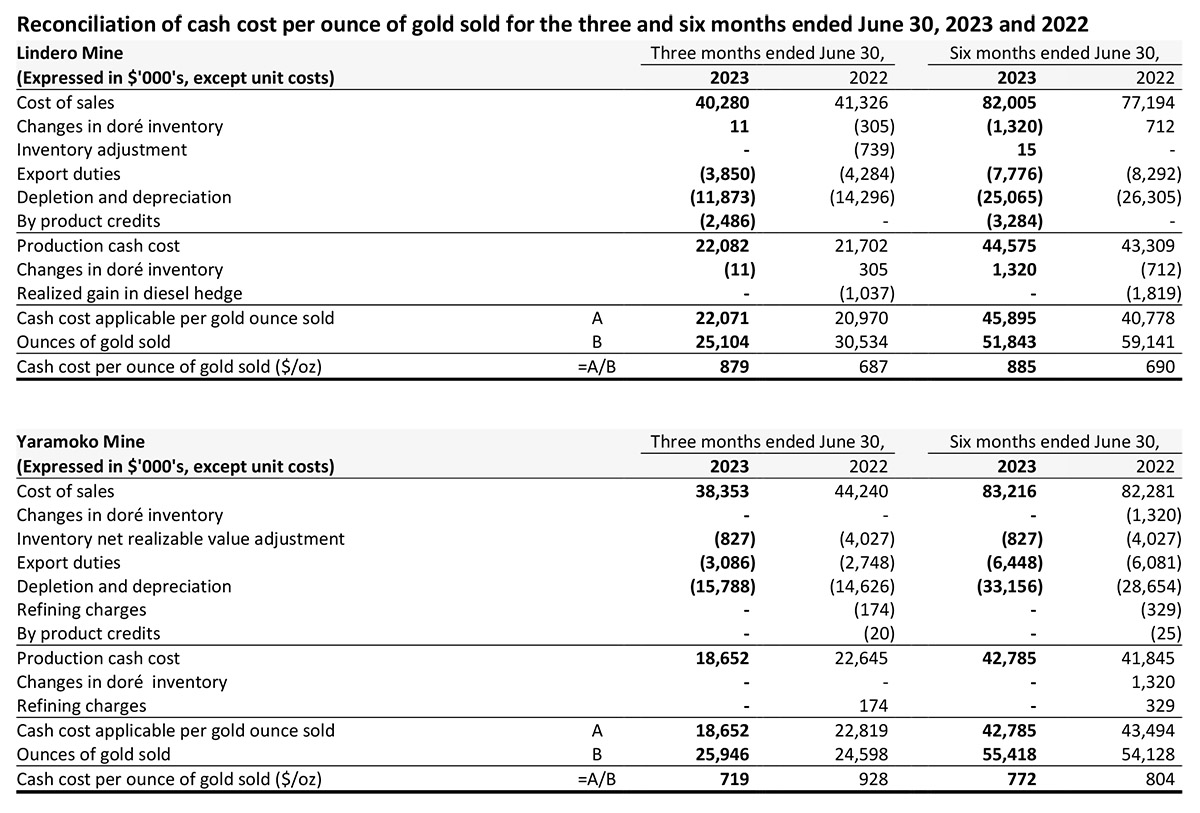
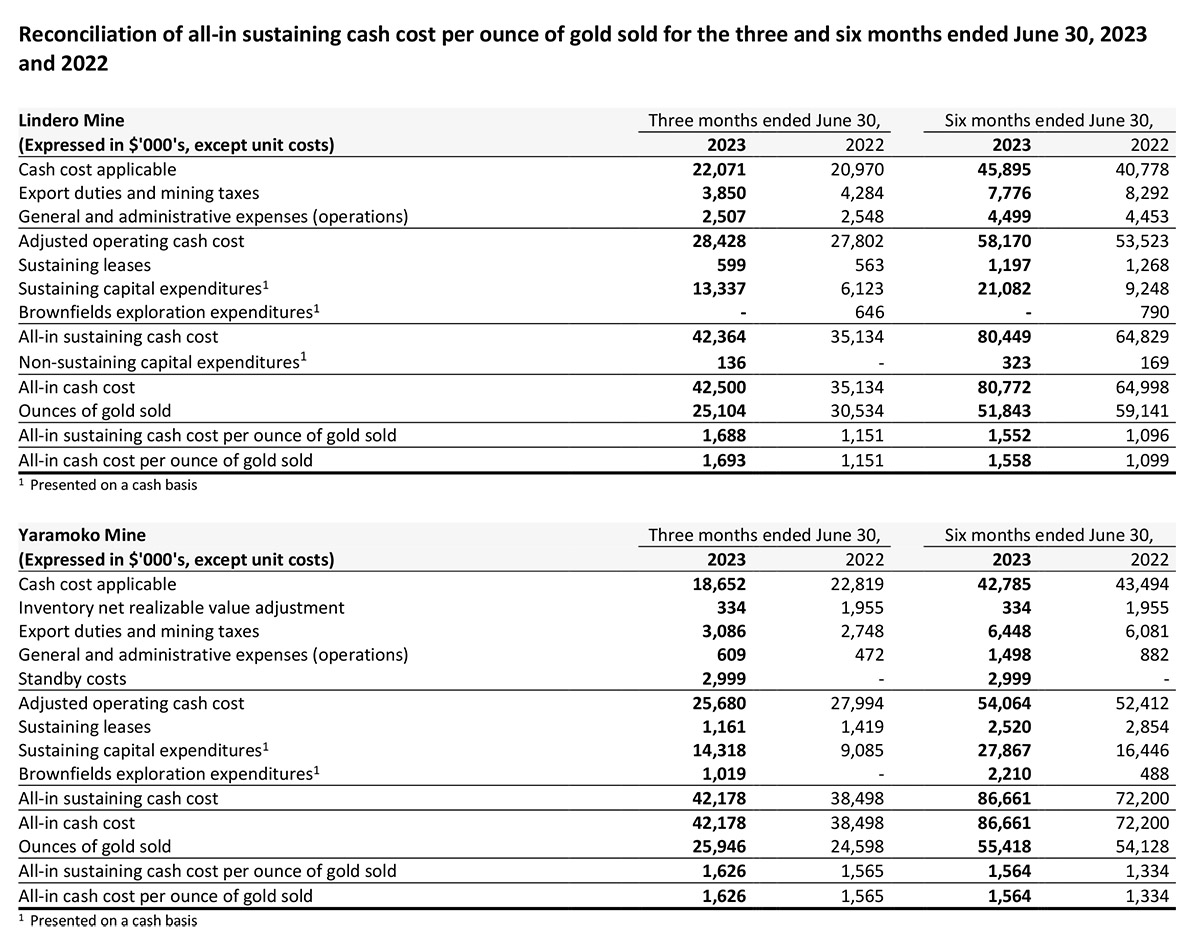
Cash cost per ounce of gold for the quarter ended June 30, 2023, was $879 compared to $687 in the same period in 2022. Cash cost per ounce of gold was higher due to higher indirect costs, and lower production. This was partially offset by higher stripping capitalization and by-product sales from copper.
All-in sustaining cash cost per gold ounce sold was $1,688 during Q2 2023 compared with $1,151 in the same period of 2022. All-in sustaining cash cost for the second quarter of 2023 was impacted by the cost issues described above, compounded by lower ounces sold and significantly higher sustaining capital spend.
During the quarter, sustaining capital expenditures were primarily driven by the development of Phase 2 of the leach pad, higher capitalized stripping, plant investments, and capitalized maintenance.
Yaramoko Mine Complex, Burkina Faso
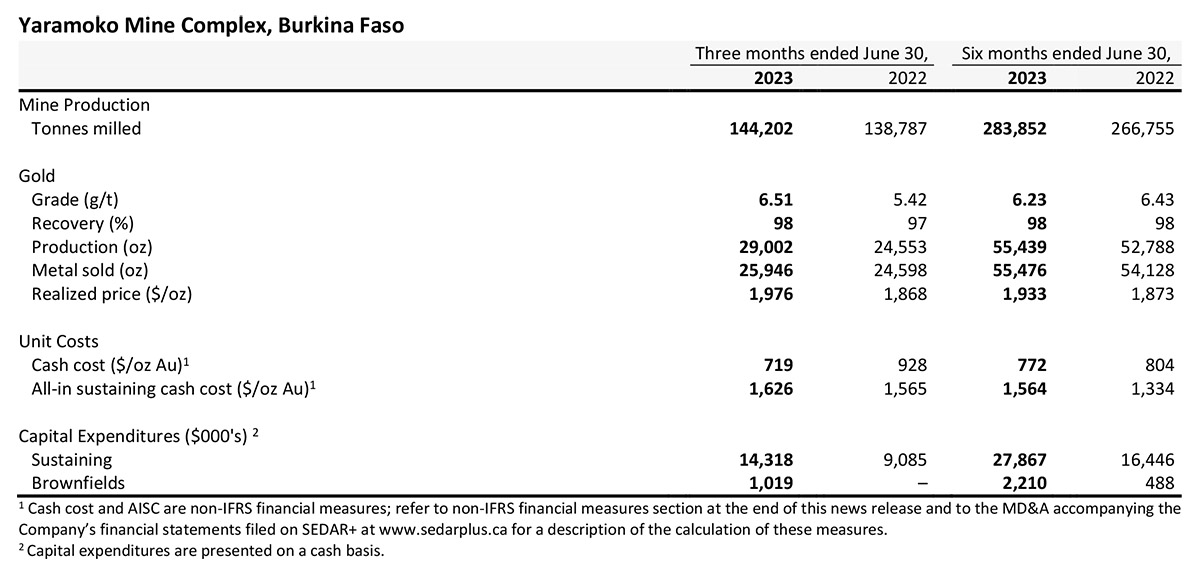
1 Cash cost and AISC are non-IFRS financial measures; refer to non-IFRS financial measures section at the end of this news release and to the MD&A accompanying the Company’s financial statements filed on SEDAR+ at www.sedarplus.ca for a description of the calculation of these measures.
2 Capital expenditures are presented on a cash basis.
The Yaramoko Mine produced 29,002 ounces of gold in the second quarter of 2023 with an average gold head grade of 6.51g/t, an 18% increase when compared to the same period in 2022. Production benefitted from higher grades mined and an increase in milled tonnes. Better than expected grades were sourced from the extension of the deposit beyond the current resource boundary on the western side of the 55 Zone. Production at Yaramoko is expected to be at the upper end of annual guidance range. In light of the recent success encountering extensions of mineralization on the fringes of the resource boundary at Zone 55, the Company expects to provide a Mineral Reserve and Mineral Resource update before year end.
Access to the underground mine was impacted for 27 days in April due to a failure of the Armtec tunnelling structure at the mine portal. Throughout this period, processing operations were maintained by milling surface ore stockpiles. Underground mine production resumed on May 1.
Cash cost per ounce of gold sold for the quarter ended June 30, 2023, was $719 compared to $928 in the same period in 2022. Cash cost per ounce decreased due to higher production and higher head grades, lower indirect costs, and lower mining costs related to lower stoping and operating development costs.
All-in sustaining cash cost per gold ounce sold was $1,626 for Q2 2023, compared to $1,565 for the same period in 2022. This increase was as a result of increased capital expenditures related to underground development, $2.0 million in stand-by charges incurred while the mine access ramp was remediated and a $1.0 million administrative penalty.
Sustaining capital for Q2 2023 was higher due to higher mine development and the Zone 55 Primary Vent Circuit extension. Brownfields expenditure was primarily related to diamond drilling.
San Jose Mine, Mexico
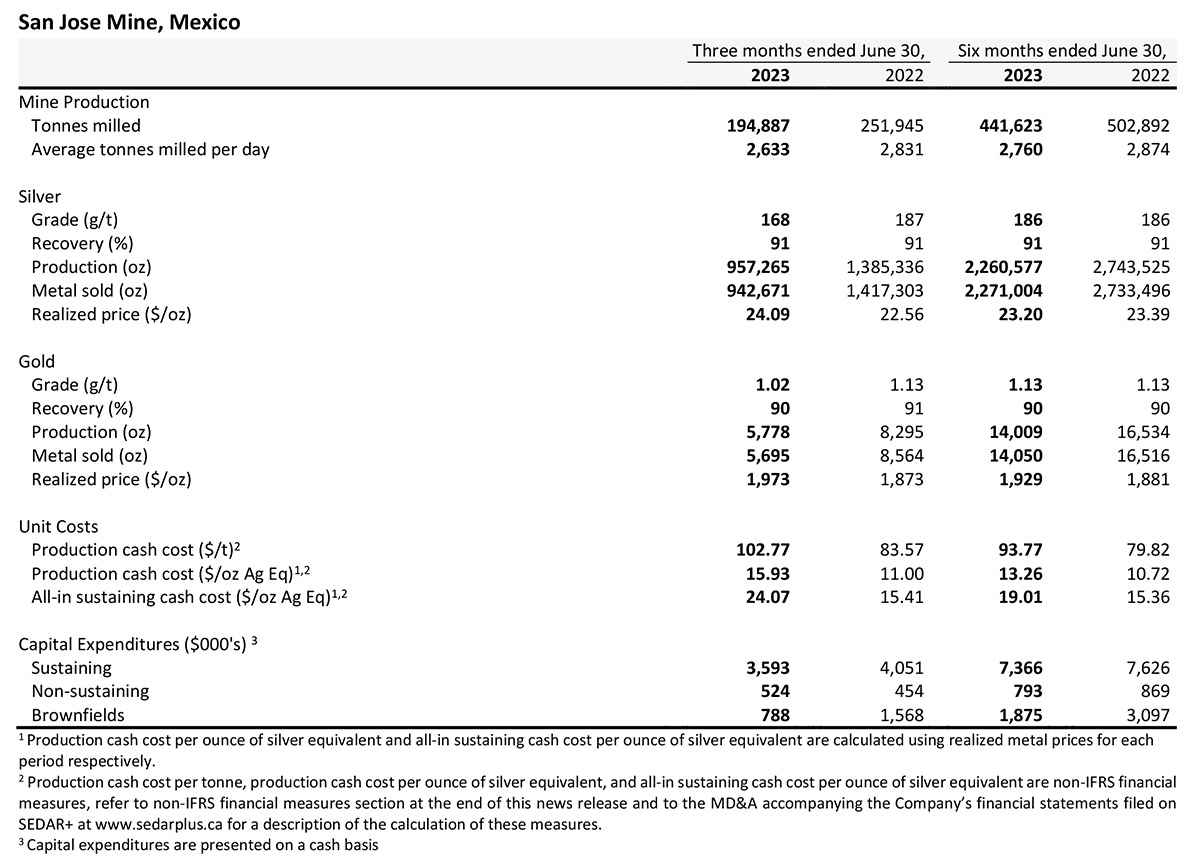
1 Production cash cost per ounce of silver equivalent and all-in sustaining cash cost per ounce of silver equivalent are calculated using realized metal prices for each period respectively.
2 Production cash cost per tonne, production cash cost per ounce of silver equivalent, and all-in sustaining cash cost per ounce of silver equivalent are non-IFRS financial measures, refer to non-IFRS financial measures section at the end of this news release and to the MD&A accompanying the Company’s financial statements filed on SEDAR+ at www.sedarplus.ca for a description of the calculation of these measures.
3 Capital expenditures are presented on a cash basis
In the second quarter of 2023, the San Jose Mine produced 957,265 ounces of silver and 5,778 ounces of gold, 31% and 30% lower, respectively, when compared to the same period in 2022.
The decrease in production is explained by the 15-day full shutdown of operations due to the illegal blockade by the workers’ union related to demands for higher profit sharing distributions and higher absenteeism and resignations of personnel following the resolution of the blockade. The 15-day shutdown reduced planned production for the quarter by 47,200 tonnes and impacted mine preparation, delaying access to higher grade stopes planned in the quarter. The Company has adjusted its mine plan to access these higher grade stopes in the third quarter and has taken the necessary steps to address worker absenteeism.
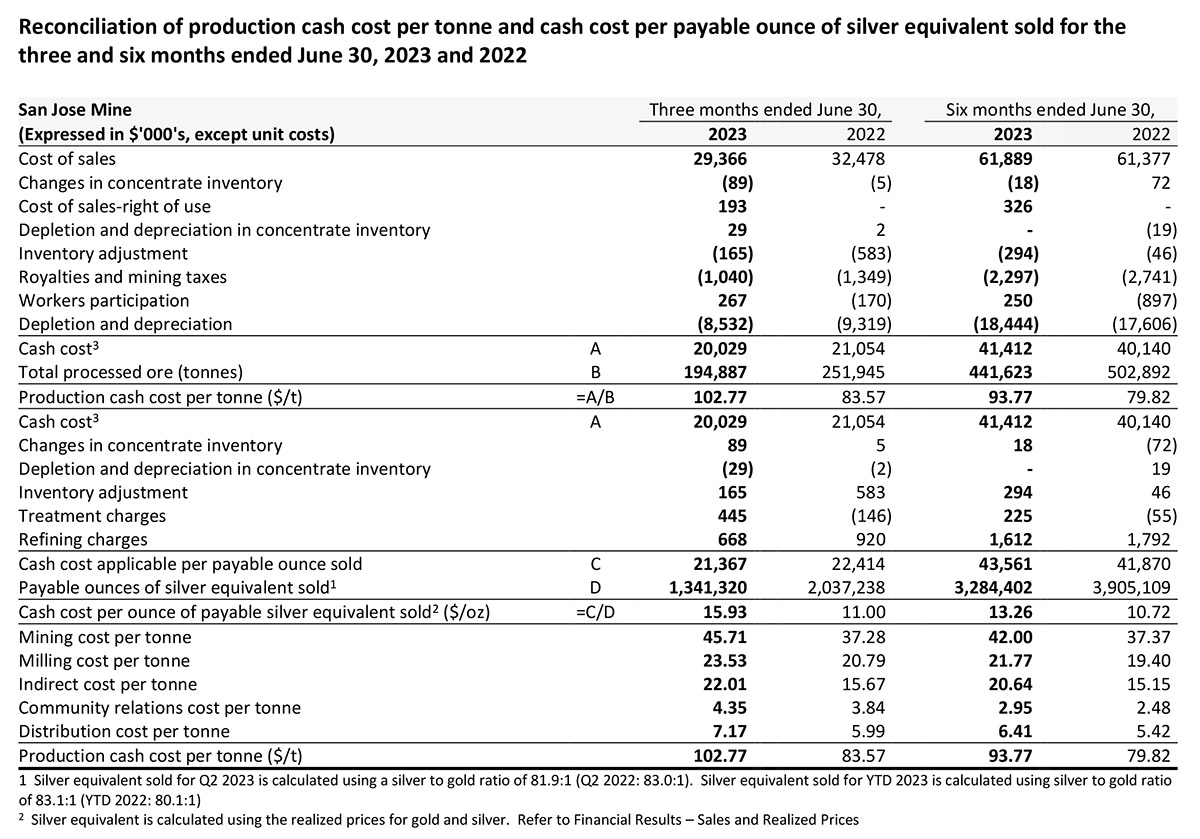
The cash cost per tonne for the three months ended June 30, 2023, was $102.77 compared to $83.57 in the same period in 2022. The increase was primarily due to inflation and the appreciation of the Mexican Peso, affecting consumables, labour costs and other services paid in Pesos. Cash cost was further negatively affected by decreased production due to the work stoppages noted earlier and the impact of the plant running below optimal throughput rates during quarter.
All-in sustaining cash costs of payable silver equivalent for the three months ended June 30, 2023, increased 24% to $24.07 per ounce, compared to $15.41 per ounce for the same period in 2022. The increase was driven by higher cash cost, lower production, and an extraordinary bonus negotiated as part of the union agreement. This was offset slightly by lower royalties and lower capital expenditures.
In the second quarter of 2023, sustaining capital expenditure was lower than the same period in 2022, due to the one-time purchase of two scooptrams in 2022. This was partially offset by higher development costs in this quarter. Brownfields expenditures continued to face challenges stemming from geological and operational delays.
Caylloma Mine, Peru
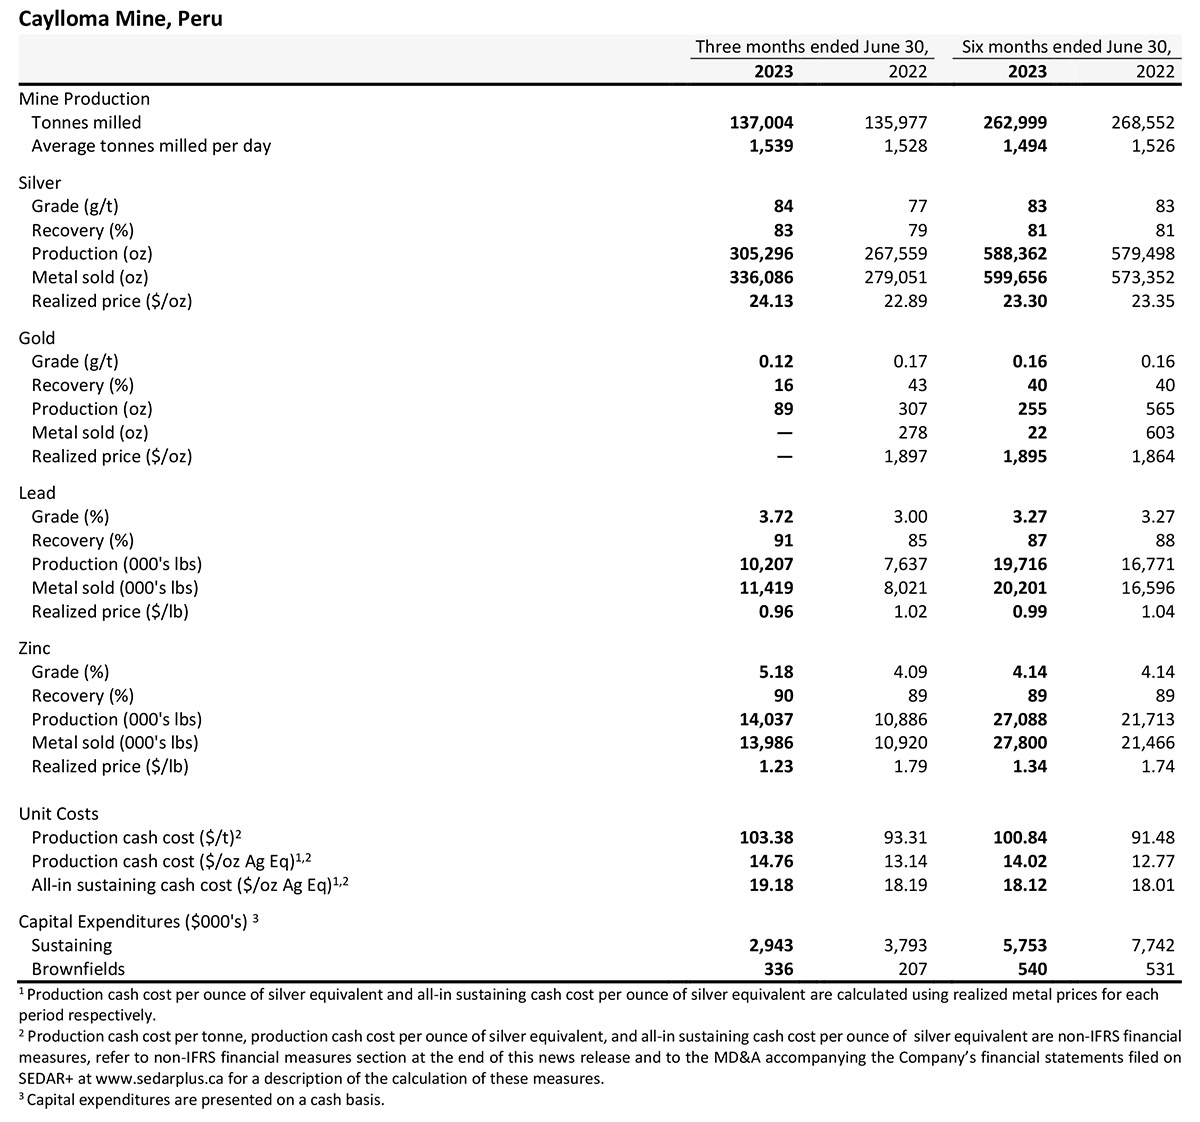
1 Production cash cost per ounce of silver equivalent and all-in sustaining cash cost per ounce of silver equivalent are calculated using realized metal prices for each period respectively.
2 Production cash cost per tonne, production cash cost per ounce of silver equivalent, and all-in sustaining cash cost per ounce of silver equivalent are non-IFRS financial measures, refer to non-IFRS financial measures section at the end of this news release and to the MD&A accompanying the Company’s financial statements filed on SEDAR+ at www.sedarplus.ca for a description of the calculation of these measures.
3 Capital expenditures are presented on a cash basis.
The Caylloma Mine produced 305,296 ounces of silver, 10.2 million pounds of lead, and 14.0 million pounds of zinc during the second quarter of 2023. Silver production was 14% higher compared to the same quarter in 2022, as production benefitted from higher grade stopes at the lower levels of the Animas vein. Lead and zinc production rose by 34% and 29% respectively, compared to the same period in 2022, due to higher head grades sourced from lower levels at the Animas vein. Gold production totaled 89 ounces with an average head grade of 0.12 g/t.
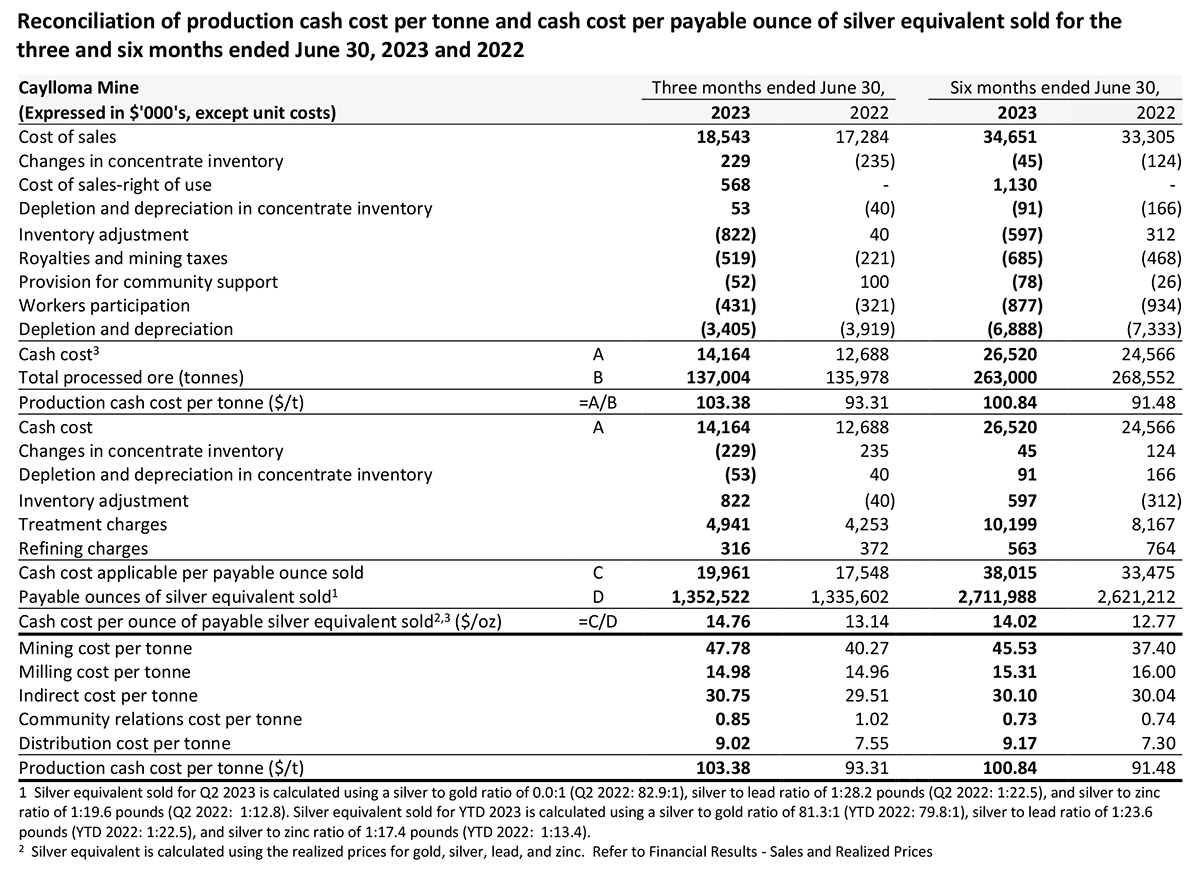
The cash cost per tonne of processed ore for the three months ended June 30, 2023 increased 11% to $103.38 compared to $93.31 in the same period in 2022. The increase was mainly due to higher mining costs driven by inflation and its direct impact on the price of materials.
The all-in sustaining cash cost per ounce of payable silver equivalent for the three months ended June 30, 2023, increased 5% to $19.18 per ounce, compared to $18.19 per ounce for the same period in 2022. The increase was driven by higher cash cost and the impact of metal prices on the calculation of silver equivalent ounces. This was partially offset slightly by lower capital expenditures.
Capital costs for the period primarily consisted of underground development in mine levels 15, 16 and 18.
Qualified Person
Eric Chapman, Senior Vice President of Technical Services, is a Professional Geoscientist of the Engineers and Geoscientists of British Columbia (Registration Number 36328), and is the Company’s Qualified Person (as defined by National Instrument 43-101). Mr. Chapman has reviewed and approved the scientific and technical information contained in this news release and has verified the underlying data.
Raul Espinoza, F.AusIMM CP, Director of Technical Services for the Company is a Qualified Person as defined by NI 43-101, and has reviewed and approved the scientific and technical information pertaining to the Séguéla Project contained in this MD&A and has verified the underlying data.
Non-IFRS Financial Measures
The Company has disclosed certain financial measures and ratios in this news release which are not defined under the International Financial Reporting Standards ("IFRS"), as issued by the International Accounting Standards Board, and are not disclosed in the Company's financial statements, including but not limited to: cash cost per ounce of gold sold; all-in sustaining cash cost per ounce of gold sold; all-in sustaining cash cost per ounce of gold equivalent sold; all-in cash cost per ounce of gold sold; production cash cost per ounce of gold equivalent; total production cash cost per tonne; cash cost per payable ounce of silver equivalent sold; all-in sustaining cash cost per payable ounce of silver equivalent sold; all-in cash cost per payable ounce of silver equivalent sold; free cash flow from ongoing operations; adjusted net income; adjusted EBITDA and working capital.
These non-IFRS financial measures and non-IFRS ratios are widely reported in the mining industry as benchmarks for performance and are used by management to monitor and evaluate the Company's operating performance and ability to generate cash. The Company believes that, in addition to financial measures and ratios prepared in accordance with IFRS, certain investors use these non-IFRS financial measures and ratios to evaluate the Company’s performance. However, the measures do not have a standardized meaning under IFRS and may not be comparable to similar financial measures disclosed by other companies. Accordingly, non-IFRS financial measures and non-IFRS ratios should not be considered in isolation or as a substitute for measures and ratios of the Company’s performance prepared in accordance with IFRS. The Company has calculated these measures consistently for all periods presented.
To facilitate a better understanding of these measures and ratios as calculated by the Company, descriptions are provided below. In addition see "Non-IFRS Financial Measures" in the Company’s management’s discussion and analysis for the three and six months ended June 30, 2023 ("Q2 2023 MDA"), which section is incorporated by reference in this news release, for additional information regarding each non-IFRS financial measure and non-IFRS ratio disclosed in this news release, including an explanation of their composition; an explanation of how such measures and ratios provide useful information to an investor and the additional purposes, if any, for which management of the Company uses such measures and ratio. The Q2 2023 MD&A may be accessed on SEDAR+ at www.sedarplus.ca under the Company’s profile.
Except as otherwise described in the Q2 2023 MD&A, the Company has calculated these measures consistently for all periods presented.
Reconciliation to adjusted net income for the three and six months ended June 30, 2023 and 2022
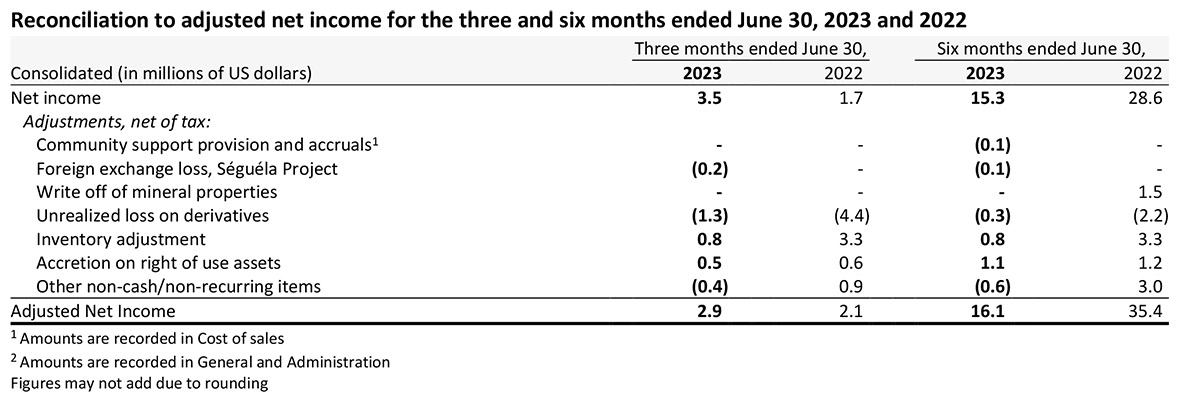
1 Amounts are recorded in Cost of sales
2 Amounts are recorded in General and Administration
Figures may not add due to rounding
Reconciliation to adjusted EBITDA for the three and six months ended June 30, 2023 and 2022
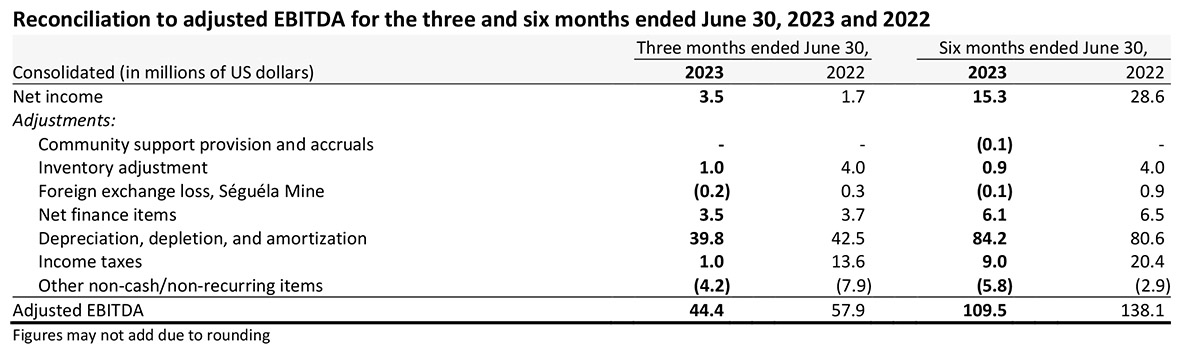
Figures may not add due to rounding
Reconciliation of free cash flow from ongoing operations for the three and six months ended June 30, 2023 and 2022
In 2022, the Company changed the method for calculating free cash flow from ongoing operations. The calculation now uses taxes paid as opposed to the previous method which used current income taxes. While this may create larger quarter over quarter fluctuations due to the timing of income tax payments, management believes the revised method is a better representation of the free cash flow generated by the Company’s ongoing operations.
Figures may not add due to rounding
Reconciliation of cash cost per ounce of gold sold for the three and six months ended June 30, 2023 and 2022
Reconciliation of cash cost per ounce of gold equivalent sold for the three and six months ended June 30, 2023 and 2022
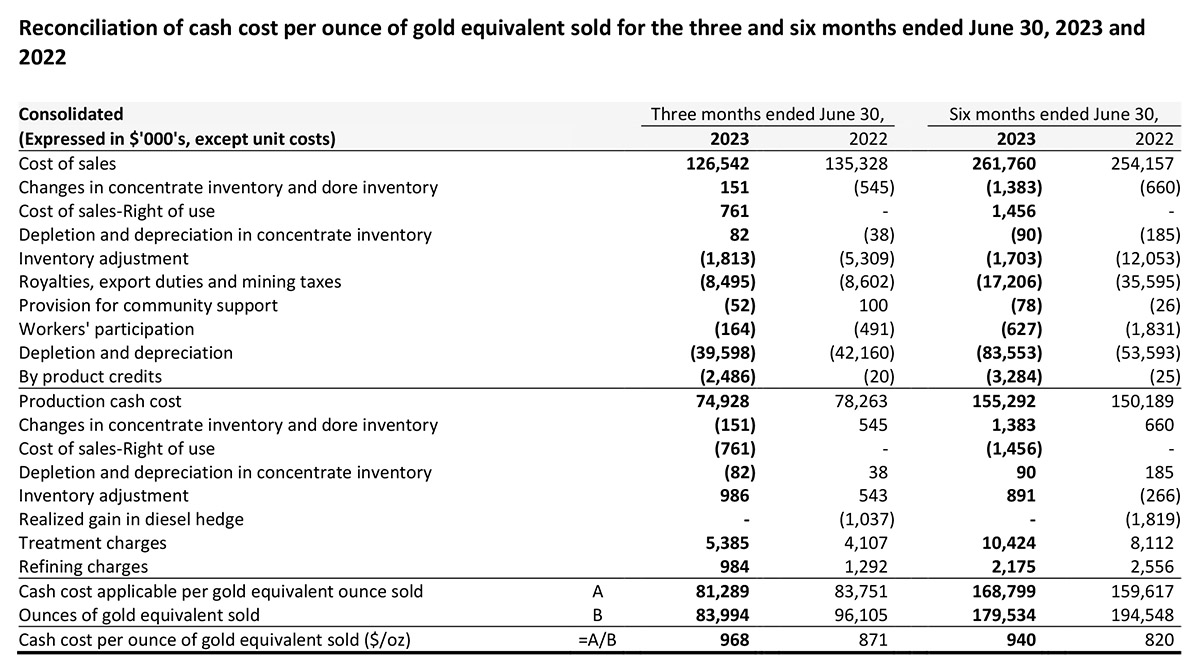
Gold equivalent was calculated using the realized prices for gold of $1,975/oz Au, $24.1/oz Ag, $2,115/t Pb, and $2,713/t Zn for Q2 2023 and using the realized prices for gold of $1,862/oz Au, $22.6/oz Ag, $2,240/t Pb, and $3,948/t Zn for Q2 2022.
Gold equivalent was calculated using the realized prices for gold of $1,930/oz Au, $23.2/oz Ag, $2,174/t Pb, and $2,954/t Zn for YTD 2023 and using the realized prices for gold of $1,877/oz Au, $23.3/oz Ag, $2,287/t Pb, and $3,844/t Zn for YTD 2022.
Reconciliation of all-in sustaining cash cost per ounce of gold sold for the three and six months ended June 30, 2023 and 2022
1 Presented on a cash basis
1 Presented on a cash basis
Reconciliation of all-in sustaining cash cost per ounce of gold equivalent sold for the three and six months ended June 30, 2023 and 2022
Gold equivalent was calculated using the realized prices for gold of $1,975/oz Au, $24.1/oz Ag, $2,115/t Pb, and $2,713/t Zn for Q2 2023 and using the realized prices for gold of $1,862/oz Au, $22.6/oz Ag, $2,240/t Pb, and $3,948/t Zn for Q2 2022.
Gold equivalent was calculated using the realized prices for gold of $1,930/oz Au, $23.2/oz Ag, $2,174/t Pb, and $2,954/t Zn for YTD 2023 and using the realized prices for gold of $1,877/oz Au, $23.3/oz Ag, $2,287/t Pb, and $3,844/t Zn for YTD 2022.
Reconciliation of production cash cost per tonne and cash cost per payable ounce of silver equivalent sold for the three and six months ended June 30, 2023 and 2022
1 Silver equivalent sold for Q2 2023 is calculated using a silver to gold ratio of 81.9:1 (Q2 2022: 83.0:1). Silver equivalent sold for YTD 2023 is calculated using silver to gold ratio of 83.1:1 (YTD 2022: 80.1:1)
2 Silver equivalent is calculated using the realized prices for gold and silver. Refer to Financial Results – Sales and Realized Prices
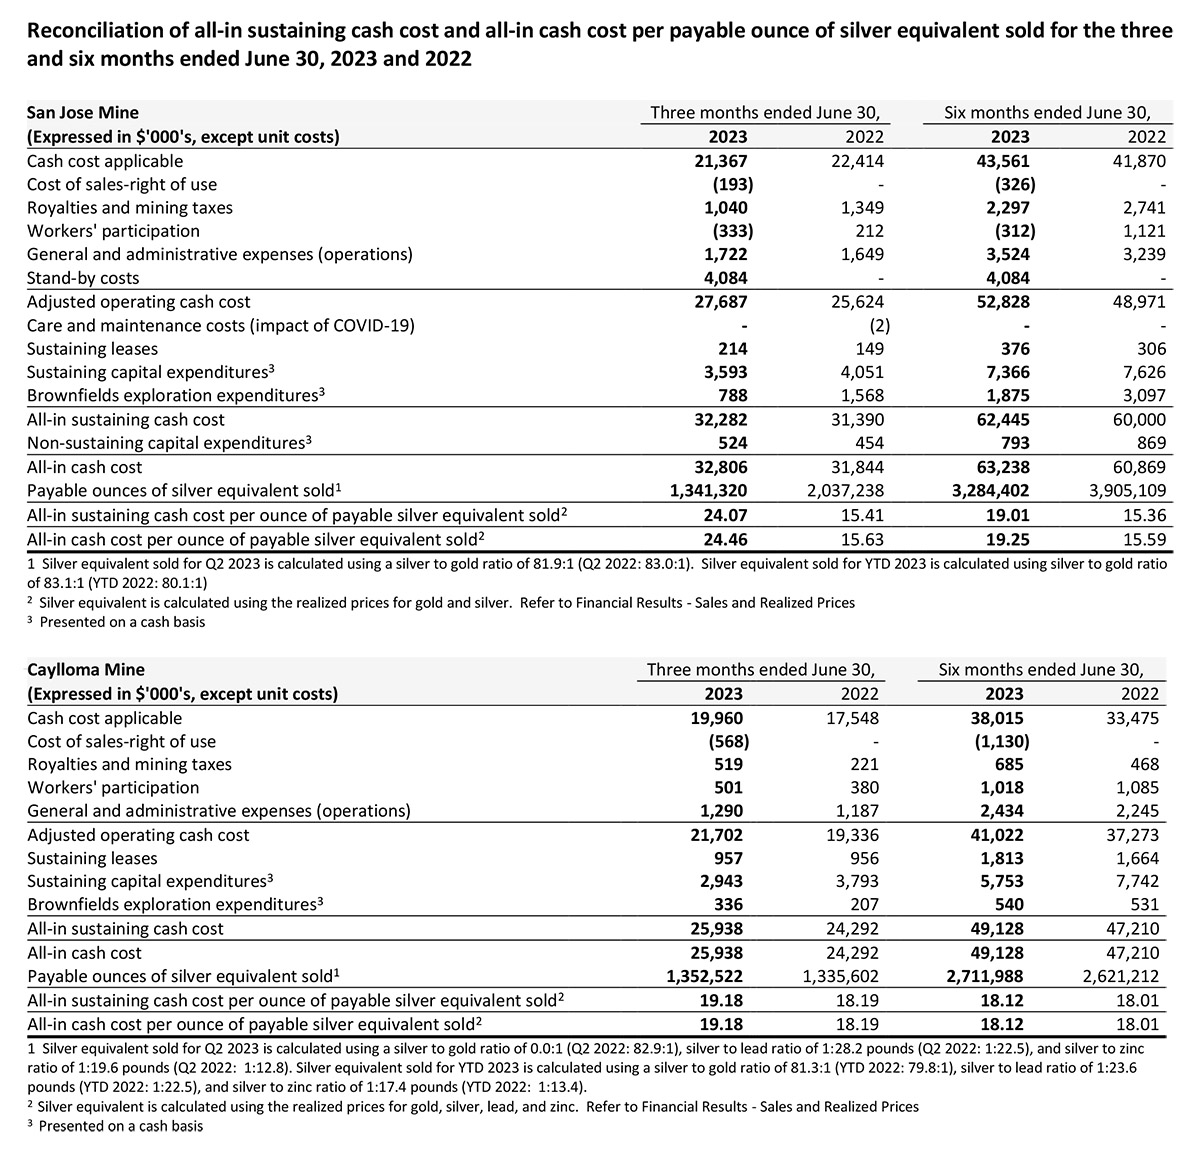
1 Silver equivalent sold for Q2 2023 is calculated using a silver to gold ratio of 0.0:1 (Q2 2022: 82.9:1), silver to lead ratio of 1:28.2 pounds (Q2 2022: 1:22.5), and silver to zinc ratio of 1:19.6 pounds (Q2 2022: 1:12.8). Silver equivalent sold for YTD 2023 is calculated using a silver to gold ratio of 81.3:1 (YTD 2022: 79.8:1), silver to lead ratio of 1:23.6 pounds (YTD 2022: 1:22.5), and silver to zinc ratio of 1:17.4 pounds (YTD 2022: 1:13.4).
2 Silver equivalent is calculated using the realized prices for gold, silver, lead, and zinc. Refer to Financial Results - Sales and Realized Prices
Reconciliation of all-in sustaining cash cost and all-in cash cost per payable ounce of silver equivalent sold for the three and six months ended June 30, 2023 and 2022
1 Silver equivalent sold for Q2 2023 is calculated using a silver to gold ratio of 81.9:1 (Q2 2022: 83.0:1). Silver equivalent sold for YTD 2023 is calculated using silver to gold ratio of 83.1:1 (YTD 2022: 80.1:1)
2 Silver equivalent is calculated using the realized prices for gold and silver. Refer to Financial Results - Sales and Realized Prices
3 Presented on a cash basis
1 Silver equivalent sold for Q2 2023 is calculated using a silver to gold ratio of 0.0:1 (Q2 2022: 82.9:1), silver to lead ratio of 1:28.2 pounds (Q2 2022: 1:22.5), and silver to zinc ratio of 1:19.6 pounds (Q2 2022: 1:12.8). Silver equivalent sold for YTD 2023 is calculated using a silver to gold ratio of 81.3:1 (YTD 2022: 79.8:1), silver to lead ratio of 1:23.6 pounds (YTD 2022: 1:22.5), and silver to zinc ratio of 1:17.4 pounds (YTD 2022: 1:13.4).
2 Silver equivalent is calculated using the realized prices for gold, silver, lead, and zinc. Refer to Financial Results - Sales and Realized Prices
3 Presented on a cash basis
Additional information regarding the Company’s financial results and activities underway are available in the Company’s audited consolidated financial statements for the three and six months ended June 30, 2023 and accompanying Q2 2023 MD&A, which are available for download on the Company’s website, www.fortunasilver.com, on SEDAR+ at www.sedarplus.ca and on EDGAR at www.sec.gov/edgar.
Conference Call and Webcast
A conference call to discuss the financial and operational results will be held on Thursday, August 10, 2023, at 9:00 a.m. Pacific time | 12:00 p.m. Eastern time. Hosting the call will be Jorge A. Ganoza, President and CEO, Luis D. Ganoza, Chief Financial Officer, Cesar Velasco, Chief Operating Officer – Latin America, David Whittle, Chief Operating Officer – West Africa, Paul Weedon, Senior Vice President, Exploration, and Julien Baudrand, Senior Vice President, Sustainability.
Shareholders, analysts, media and interested investors are invited to listen to the live conference call by logging onto the webcast at: https://www.webcaster4.com/Webcast/Page/1696/48784 or over the phone by dialing in just prior to the starting time.
Conference call details:
Date: Thursday, August 10, 2023
Time: 9:00 a.m. Pacific time | 12:00 p.m. Eastern time
Dial in number (Toll Free): +1.888.506.0062
Dial in number (International): +1.973.528.0011
Access code: 333780
Replay number (Toll Free): +1.877.481.4010
Replay number (International): +1.919.882.2331
Replay passcode: 48784
Playback of the earnings call will be available until Thursday, August 24, 2023. Playback of the webcast will be available until Saturday, August 10, 2024. In addition, a transcript of the call will be archived on the Company’s website.
About Fortuna Silver Mines Inc.
Fortuna Silver Mines Inc. is a Canadian precious metals mining company with four operating mines in Argentina, Burkina Faso, Côte d’Ivoire, Mexico, and Peru. Sustainability is integral to all our operations and relationships. We produce gold and silver and generate shared value over the long-term for our stakeholders through efficient production, environmental protection, and social responsibility. For more information, please visit our website.
ON BEHALF OF THE BOARD
Jorge A. Ganoza
President, CEO, and Director
Fortuna Silver Mines Inc.
Investor Relations:
Carlos Baca | moc.revlisanutrof@ofni | www.fortunasilver.com | X | LinkedIn | YouTube
Forward-looking Statements
This news release contains forward-looking statements which constitute "forward-looking information" within the meaning of applicable Canadian securities legislation and "forward-looking statements" within the meaning of the "safe harbor" provisions of the Private Securities Litigation Reform Act of 1995 (collectively, "Forward-looking Statements"). All statements included herein, other than statements of historical fact, are Forward-looking Statements and are subject to a variety of known and unknown risks and uncertainties which could cause actual events or results to differ materially from those reflected in the Forward-looking Statements. The Forward-looking Statements in this news release include, without limitation, statements about the Company's plans for its mines and mineral properties; the Company’s anticipated financial and operational performance in 2023; estimated production and costs of production for 2023, including grade and volume of metal produced and sales, revenues and cashflows, and capital costs (sustaining and non-sustaining), and operating costs, including projected production cash costs and all-in sustaining costs; the ability of the Company to mitigate the inflationary pressures on supplies used in its operations; estimated capital expenditures and estimated exploration spending in 2023, including amounts for exploration activities at its properties; the anticipated timeline to ramp up production to design capacity at the Séguéla Mine and anticipated gold production in 2023; statements regarding the Company's liquidity, access to capital; the impact of high inflation on the costs of production and the supply chain; the Company's business strategy, plans and outlook; the merit of the Company's mines and mineral properties; mineral resource and reserve estimates, metal recovery rates, concentrate grade and quality; changes in tax rates and tax laws, requirements for permits, anticipated approvals and other matters. Often, but not always, these Forward-looking Statements can be identified by the use of words such as "estimated", "expected", "anticipated", "potential", "open", "future", "assumed", "projected", "used", "detailed", "has been", "gain", "planned", "reflecting", "will", "containing", "remaining", "to be", or statements that events, "could" or "should" occur or be achieved and similar expressions, including negative variations.
Forward-looking Statements involve known and unknown risks, uncertainties and other factors which may cause the actual results, performance or achievements of the Company to be materially different from any results, performance or achievements expressed or implied by the Forward-looking Statements. Such uncertainties and factors include, among others, changes in general economic conditions and financial markets; ; uncertainty relating to new mining operations such as the Séguéla Mine, including the possibility that actual capital and operating costs and economic returns will differ significantly from those estimated for such projects prior to production; Fortuna’s ability to ramp up in production to design capacity at the Séguéla Mine as estimated; risks associated with war or other geo-political hostilities, such as the Ukrainian – Russian conflict, any of which could continue to cause a disruption in global economic activity; fluctuation in currencies and foreign exchange rates; increases in the rate of inflation; the imposition or any extension of capital controls in countries in which the Company operates; any changes in tax laws in Argentina and the other countries in which we operate; changes in the prices of key supplies; technological and operational hazards in Fortuna’s mining and mine development activities; risks inherent in mineral exploration; uncertainties inherent in the estimation of mineral reserves, mineral resources, and metal recoveries; changes to current estimates of mineral reserves and resources; changes to production and cost estimates; the ability of Minera Cuzcatlan to successfully contest and revoke the resolution of SEMARNAT which revoked the environmental impact authorization at the San Jose mine; changes in the position of regulatory authorities with respect to the granting of approvals or permits; governmental and other approvals; changes in government, political unrest or instability in countries where Fortuna is active; labor relations issues; as well as those factors discussed under "Risk Factors" in the Company's Annual Information Form. Although the Company has attempted to identify important factors that could cause actual actions, events or results to differ materially from those described in Forward-looking Statements, there may be other factors that cause actions, events or results to differ from those anticipated, estimated or intended.
Forward-looking Statements contained herein are based on the assumptions, beliefs, expectations and opinions of management, including but not limited to the accuracy of the Company’s current mineral resource and reserve estimates; that the Company’s activities will be conducted in accordance with the Company’s public statements and stated goals; that there will be no material adverse change affecting the Company, its properties or changes to production estimates (which assume accuracy of projected ore grade, mining rates, recovery timing, and recovery rate estimates and may be impacted by unscheduled maintenance, labour and contractor availability and other operating or technical difficulties); that production at the Séguéla Mine will ramp up to design capacity as anticipated; geo-political uncertainties that may affect the Company’s production, workforce, business, operations and financial condition; the expected trends in mineral prices and currency exchange rates; that the Company will be successful in mitigating the impact of inflation on its business and operations; that Minera Cuzcatlan will be successful in the legal proceedings to reinstate the environmental impact authorization at the San Jose mine; that all required approvals and permits will be obtained for the Company’s business and operations on acceptable terms; that there will be no significant disruptions affecting the Company's operations, the ability to meet current and future obligations and such other assumptions as set out herein. Forward-looking Statements are made as of the date hereof and the Company disclaims any obligation to update any Forward-looking Statements, whether as a result of new information, future events or results or otherwise, except as required by law. There can be no assurance that these Forward-looking Statements will prove to be accurate, as actual results and future events could differ materially from those anticipated in such statements. Accordingly, investors should not place undue reliance on Forward-looking Statements.
Cautionary Note to United States Investors Concerning Estimates of Reserves and Resources
Reserve and resource estimates included in this news release have been prepared in accordance with National Instrument 43-101 Standards of Disclosure for Mineral Projects ("NI 43-101") and the Canadian Institute of Mining, Metallurgy, and Petroleum Definition Standards on Mineral Resources and Mineral Reserves. NI 43-101 is a rule developed by the Canadian Securities Administrators that establishes standards for public disclosure by a Canadian company of scientific and technical information concerning mineral projects. Unless otherwise indicated, all mineral reserve and mineral resource estimates contained in the technical disclosure have been prepared in accordance with NI 43-101 and the Canadian Institute of Mining, Metallurgy and Petroleum Definition Standards on Mineral Resources and Reserves. Canadian standards, including NI 43-101, differ significantly from the requirements of the Securities and Exchange Commission, and mineral reserve and resource information included in this news release may not be comparable to similar information disclosed by U.S. companies.