Fortuna Reports Results for the Fourth Quarter and Full Year 2023
March 6, 2024 08:39 PM PST
(All amounts expressed in US dollars, tabular amounts in millions, unless otherwise stated)
Vancouver, March 6, 2024: Fortuna Silver Mines Inc. (NYSE: FSM) (TSX: FVI) (“Fortuna” or the “Company”) today reported its financial and operating results for the fourth quarter and full year 2023.
Fourth Quarter and Full Year 2023 highlights
Financial
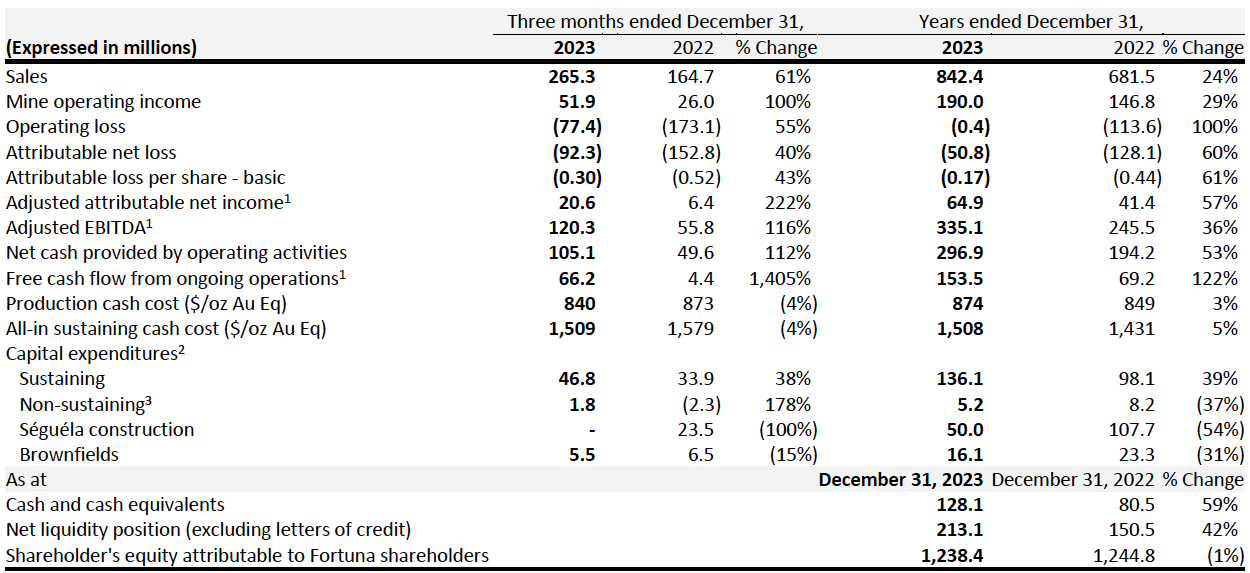
- Attributable net loss for the quarter of $92.3 million or $0.30 per share after non-cash impairment charges of $90.6 million in Q4 2023, totaling an attributable net loss of $50.8 million for the full year 2023
- Attributable adjusted net income1 of $20.6 million or $0.07 per share in Q4 2023, totaling $64.9 million, or $0.22 per share for the full year 2023
- Net cash generated by operations for the quarter was $105.1 million or $0.36 per share in Q4 2023, totaling $296.3 million or $ 1.0 per share for the full year 2023
- Free cash flow from ongoing operations1 of $66.2 million in Q4 2023; totaling $153.5 million for the full year 2023
- The Company repaid $41.0 million of its corporate credit facility in the fourth quarter and the total net debt1 at year end stands at $83.0 million. An additional payment of $25.0 million was made subsequent to year end.
- Liquidity as at December 31, 2023 was $213.1 million
Operational
- Record gold equivalent production of 136,154 ounces3 in Q4 2023 and record annual gold equivalent production of 452,389 ounces3; representing increases of 6 and 13 percent compared to the respective periods in 2022
- Record gold production of 107,376 ounces in Q4 2023 and 326,638 ounces for the full year 2023
- Silver production of 1,354,003 ounces in Q4 2023 and 5,883,691 ounces for the full year 2023
- Consolidated cash cost per gold equivalent ounce1 of $840 in Q4 2023 and $874 for the full year 2023
- Consolidated AISC per gold equivalent ounce1 of $1,509 for Q4 2023 and $1,508 for the full year 2023
- Continuous trend of improvement in annual safety performance across the business with a Total Recordable Injury Frequency Rate (TRIFR) of 1.22, and a Lost Time Injury Frequency Rate (LTIFR) of 0.36, compared to 2.32 and 0.39 in 2022
Growth and Development
- During the fourth quarter of 2023 the Company initiated a 45,000-meter drill program at its newly acquired Diamba Sud project in Senegal. Subject to results the Company plans to produce a Preliminary Economic Assessment by the end of 2024
- At the end of December 2023, the Séguéla Mine processing facility was performing 26% above name plate capacity. For 2024 management has identified opportunities to further optimize and debottleneck throughput.
Jorge A. Ganoza, President and CEO, commented, “In the fourth quarter Fortuna delivered strong free cash-flow from ongoing operations of $65 million compared to $70 million in the third quarter. The Company also achieved record gold equivalent production of 136,154 ounces and record sales of $265.3 million, representing increases of 6% and 9% respectively compared to Q3.” Mr. Ganoza added, “Fourth quarter net earnings were impacted by non-cash write-downs and the remaining short life of reserves at San Jose, where we have recorded a non-cash impairment charge of $90.6 million. At San Jose our exploration continues pursuing the discovery of new resources with the aim of extending production beyond 2024.”
1 Refer to Non-IFRS financial measures
2 AISC/oz Ag Eq calculated at realized metal prices, refer to mine site results for realized prices and Non-IFRS Financial Measures for silver equivalent ratio
3 Gold equivalent production includes gold, silver, lead and zinc and is calculated using the following metal prices: $1,802/oz Au, $21.75/oz Ag, $2,161/t Pb and $3,468/t Zn or Au:Ag = 1:82.89, Au:Pb = 1:0.83, Au:Zn = 1:0.52
Mr. Ganoza continued, “Fortuna had a strong close to 2023, with record annual gold production exceeding guidance and silver falling short by 7%. Gold equivalent production increased 13% to a record 452,389 gold equivalent ounces compared to 2022, and we have guided further growth in 2024. Record annual sales of $842.4 million were 24% above 2022. All our mines met or improved site AISC guidance for the year with the only exception being the San Jose Mine, which is operating on the tail end of reserves and had to contest with an illegal blockade at the beginning of the year.
Mr. Ganoza concluded, “For 2024 our capital allocation priorities continue to be centered on providing maximum balance sheet flexibility through further debt reduction, and funding of aggressive organic growth programs with approximately 200,000 meters of exploration drilling planned across the portfolio. The Diamba Sud project in Senegal and the Séguéla Mine in Côte d´Ivoire are priorities for our exploration programs during the year.”
Fourth Quarter 2023 and Full Year 2023 Consolidated Results
Fourth Quarter 2023 Results
Attributable Net Loss and Adjusted Net Income
Attributable net loss for the period was $92.3 million compared to an attributable net loss of $152.8 million in Q4 2022 The loss in the quarter is explained by the following items:
- An impairment charge of $90.6 million related to the anticipated closure of the San Jose Mine in late 2024, as the updated mine plan is scheduled to exhaust Mineral Reserves by the end of the year compared to mid-2025 as previously planned
- A write-down of materials inventory of $10.1 million at the San Jose, Yaramoko and Lindero Mines
- A write-down of low-grade ore stockpiles of $5.4 million at the Lindero Mine
- A $6.4 million severance provision associated with the scheduled closure of the San Jose Mine
- A write-down of $5.9 million related to greenfield exploration projects in Mexico and Argentina
After adjusting for impairment charges and other non-recurring items, adjusted attributable net income was $20.6 million or $0.07 per share compared to $6.4 million or $0.02 per share in Q4 2022. The increase was primarily due to higher gold sales volume and higher gold prices. Higher gold sales volume was mainly due to the contribution of Séguéla in its second full quarter of production. This was combined with 7% higher sales at Yaramoko from higher processed head grade. This was partially offset by lower sales at San Jose related to lower head grades consistent with the Mineral Reserve and a reduction in mined tonnage related to operational challenges in backfilling and blasting activities. The realized gold price was $1,990 per ounce in Q4 2023 compared to $1,737 per ounce in Q4 2022.
Other items impacting the adjusted net income for the quarter compared to Q4 2022 were higher G&A of $3.3 million, mostly related to the addition of Séguéla G&A and timing of execution on certain corporate G&A items; higher foreign exchange loss of $2.4 million primarily related to 118% devaluation of the official exchange rate in Argentina as part of the measures taken by the new elected government to achieve a more sustainable real exchange rate in the short term; Other expenses of $2.7 million related to administrative penalties at Yaramoko, and a higher interest expense of $4.0 million as a result of higher interest rates and $1.4 million of interest charges capitalized in Q4 2022 vs nil in Q4 2023. This was partially offset by $12.4 million of investment income related to cross-border, Argentine pesos denominated bond trades.
Depreciation and Depletion
Depreciation and depletion increased $27.1 million to $71.6 million in the fourth quarter of 2023 compared to $44.5 million in the comparable period of 2022. The increase was primarily due to an increase in ounces sold as well as higher depletion per ounce at Séguéla due to the depletion of the purchase price allocation from the Roxgold acquisition of $17.1 million.
Adjusted EBITDA and Cash Flow
Adjusted EBITDA for the quarter was $120.3 million, a margin of 45% over sales, compared to $55.8 million and margin over sales of 34%, reported in the same period in 2022. The main driver for the increase in EBITDA was the contribution from Séguéla with EBITDA margin of 73% in Q4 2023, combined with higher EBITDA from Yaramoko related to higher gold output. In addition, adjusted EBITDA reflects the positive impact from the inclusion of $12.4 million of investment income at our Argentine operations. The trade associated with the investment income was a one-off event executed under a time limited waiver granted by the government of Argentina in Q4 to allow exporters a partial recovery of economic losses incurred from the accumulated lag of the nominal exchange rate with respect to inflation.
Net cash generated by operations for the quarter was $105.1 million or $0.34 per share compared to $49.6 million or $0.17 per share in Q4 2022. The increase of $54.8 million reflects higher EBITDA of $61.8 million.
Free cash flow from ongoing operations for the quarter was $66.2 million compared to $4.4 million in Q4 2022. The increase reflects higher net cash generated by operations.
Cash cost per ounce and AISC
Cash cost per gold equivalent ounce was $840, a decrease from the $873 reported in Q4 2022 as the contribution of lower cost ounces from Séguéla in Q4 2023 was offset by partially offset by higher cost per ounce at San Jose, which increased by over 64% due to lower production and higher costs year over year. This combined with higher cost per gold ounce at Lindero and Yaramoko of $120 and $131 respectively associated with lower head grades at Lindero and higher costs in Q4 2023 at Yaramoko. AISC per gold equivalent ounce was $1,509 in Q4, slightly below the $1,579 recorded the prior year due to lower capex on a per ounce basis, partially offset by higher royalties related to the higher realized gold price.
Full Year 2023 Results
Attributable Net Loss and Adjusted Net Income
Attributable net loss for the year was $50.8 million, compared to an attributable net loss of $128.1 million in 2022. The loss in 2023 is explained by impairment charges of $90.6 million at the San Jose Mine explained above.
After adjusting for impairment charges and other non-recurring items, attributable adjusted net income for 2023 was $64.9 million or $0.22 per share, compared to $41.4 million or $0.14 per share in 2022. The increase was primarily due to higher gold sales volume and higher gold prices. Higher gold sales volume was mainly due to the contribution of Séguéla in the second half of the year upon successful commissioning and ramp-up in Q2 2023, and higher sales volume at Yaramoko explained by higher processed head grades in 2023. This was partially offset by lower production at Lindero, aligned with the grade profile in the mine plan, and lower head grades and processed ore at San Jose, explained by declining head grades in reserves and the impact of the 15 day mine stoppage in Q2 and related lingering operational challenges during the year. The realized gold price was $1,948 per ounce in 2023 compared to $1,802 per ounce in 2022.
Other items impacting the adjusted net income compared to 2022 were higher G&A of $2.7 million, mostly related to the addition of Séguéla G&A; higher foreign exchange loss of $4.6 million mostly related to the devaluation of the Argentine peso as described above; higher other expenses of $9.7 million related to $3.5 million of stand-by charges at San Jose and Yaramoko in Q2 2023, $2.8 million related to a new agreement with the worker´s union at San Jose in Q2 2023, and $3.7 million of administrative penalties at Yaramoko payable to the Ministry of Mines recorded in Q2 and Q4 2023, and a higher interest expense of $7.5 million as a result of an increased debt balance outstanding, higher interest rates and discontinued capitalized interest charges in the second half of the year. This was partially offset by $12.4 million of investment income related to cross-border, Argentine pesos denominated bond trades.
Depreciation and Depletion
Depreciation and depletion for 2023 increased $46.8 million to $219.7 million compared to $172.8 million in 2022. The increase was primarily due an increase in ounces sold, the start of depletion at Séguéla, including $25.3 million related to the purchase price allocation from Roxgold, and higher depletion at Yaramoko due to declining reserves which increased the depletion rate of new capital additions underground.
Adjusted EBITDA and Free Cash Flow
Adjusted EBITDA for the year was $335.1 million, a margin of 40% over sales, compared to $245.5 million reported in 2022, representing a margin of 36% over sales. The main drivers for the increase were the contribution of Séguéla with EBITDA margin of 69%, and higher production and improved margins at Yaramoko. In addition, adjusted EBITDA reflects the positive impact from the inclusion of $12.4 million of investment income at our Argentine operations as described above.
Net cash generated by operations for 2023 was $296.9 million or $1.00 per share compared to $194.2 million or $0.67 per share in 2022. The increase of $102.7 million is explained by higher EBITDA of $89.6 million combined with lower income tax paid of $16.3 million in 2023 primarily due to lower taxes paid at the San Jose Mine, no taxes paid at the Séguéla Mine in 2023 and higher repatriation withholding taxes incurred in 2022.
Free cash flow from ongoing operations for 2023 was $153.5 million compared to $69.2 million in 2022. The increase of $84.3 million reflects higher net cash generated by operations, partially offset by higher sustaining capital expenditures, including brownfields explorations. Sustaining capital expenditures on a cash basis increased by $27.6 million to $143.6 million explained by higher CAPEX at Lindero related to the leach-pad expansion and capex incurred at Séguéla in the second half of 2023.
Cash cost per ounce and AISC
Cash cost per equivalent gold ounce was $874, slightly above the $849 reported in 2022 as the contribution of lower cost ounces from Séguéla in the second half of 2023 was offset by higher cost per gold ounce at Lindero of $182 related mainly to lower planned head grades in 2023, and higher cost per equivalent gold ounce at San Jose of $379 explained primarily by lower processed ore and lower head grades.
AISC per ounce of gold equivalent of $1,508 in 2023 was $77 above the $1,431 recorded the prior year due mainly to higher cash cost per gold equivalent ounce and higher capex at Lindero related to the leach pad expansion.
Liquidity
Total liquidity available to the Company as at December 31, 2023 was $213.1 million, comprised of $128.1 million of cash and cash equivalents and $85.0 million undrawn (excluding letters of credit) on the Company’s revolving $250.0 million credit facility. Total net debt as of the end of the quarter was $83.2 million.
Subsequent to the year end the Company paid down an additional $25.0 million on its corporate credit facility, taking the outstanding debt amount to $140.0 million.
Lindero Mine, Argentina
1 Cash cost and AISC are non-IFRS financial measures. Refer to Non-IFRS Financial Measures section at the end of this news release and to the MD&A accompanying the Company’s financial statements filed on SEDAR+ at www.sedarplus.ca for a description of the calculation of these measures.
2 Capital expenditures are presented on a cash basis.
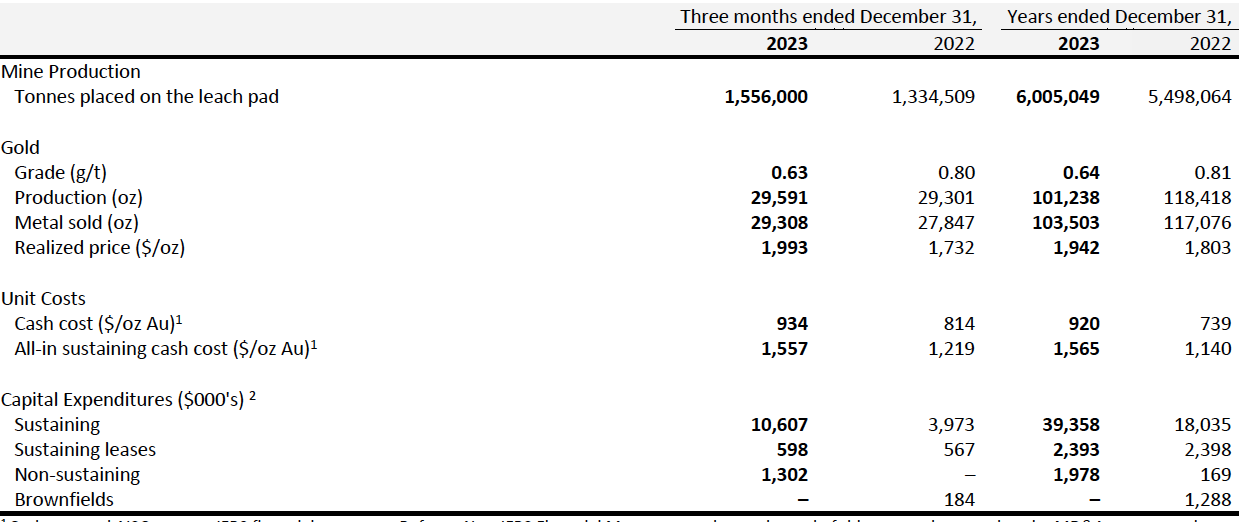
In the fourth quarter of 2023, a total of 1,556,000 tonnes of ore were placed on the heap leach pad, with an average gold grade of 0.63 g/t, containing an estimated 31,665 ounces of gold. Gold production for Q4 2023 totaled 29,591 ounces. This represents a 1% increase in total ounces, from the previous quarter. Gold production was comprised of 24,977 ounces in doré bars, 4,443 ounces of gold contained in fine carbon, and 171 ounces contained in copper concentrate. Ore mined was 2.1 million tonnes, with a stripping ratio of 0.6:1. The stripping ratio in the fourth quarter was 45 percent lower than the third quarter of 2023.
For the full year 2023 gold production totaled 101,238 ounces, achieving midpoint of annual production guidance. Gold production comprised of 94,905 ounces in doré bars, 6,015 ounces in gold contained in fine carbon, and 319 ounces contained in copper concentrate. The stripping ratio for 2023 was 1.14:1, aligned with the mining plan for the year.
The cash cost per ounce of gold for the quarter ending December 31, 2023, was $934 compared to $814 in the same period of 2022. For the year ending December 31, 2023, the cash cost per ounce was $920, an increase from $739 in 2022. The increase in cash cost per ounce of gold for both the quarter and for the full year was primarily due to lower processed gold grades in accordance with the mine plan.
The all-in sustaining cash cost per gold ounce sold during Q4 2023 was $1,557, up from $1,219 in the fourth quarter of 2022. For the full year of 2023, the all-in sustaining cash cost was $1,565, compared to $1,140 in 2022. The increase both for the quarter and the year was driven by higher cash costs, along with increased sustaining capital expenditures related to the leach pad expansion. This was partially mitigated by higher copper by-product credits.
As of December 31, 2023, the leach pad expansion project is approximately 23% complete. Mobilization of the civil contractor’s personnel and equipment has advanced with earth moving activities having commenced in January. Deliveries of geomembrane and geosynthetic clay liner are on-track, with the remaining materials expected to arrive on site in the first quarter of 2024. The leach pad expansion remains on schedule for completion during the second half of 2024.
Yaramoko Mine, Burkina Faso
1 Cash cost and AISC are non-IFRS financial measures. Refer to Non-IFRS Financial Measures section at the end of this news release and to the MD&A accompanying the Company’s financial statements filed on SEDAR+ at www.sedarplus.ca for a description of the calculation of these measures.
2 Capital expenditures are presented on a cash basis.
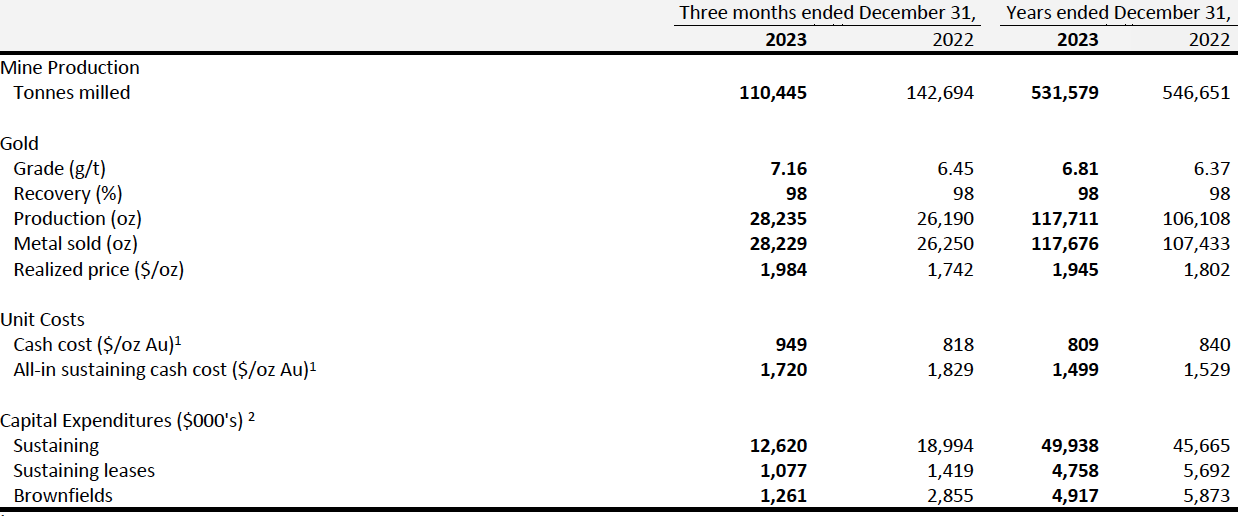
The Yaramoko Mine produced 28,235 ounces of gold in the fourth quarter of 2023 with an average gold head grade of 7.16 g/t, 8% and 11% increases when compared to the same period in 2022. Higher production was due to higher grades partially offset by lower mill throughput in the fourth quarter and a planned maintenance shutdown in December.
Gold production in 2023 totaled 117,711 ounces, achieving the higher end of the annual guidance range.
The cash cost per ounce of gold sold for the quarter ended December 31, 2023, was $949 compared to $818 in the same period in 2022. The increase for the quarter is mainly attributed to higher mining costs, particularly due to equipment, energy, and overhead expenses, but was partially offset by higher gold production. For the year ending December 31, 2023, the cash cost per ounce of gold sold was $809, a decrease from $840 in 2022. The full year decrease is mainly due to increased production and lower mining costs during prior quarters.
The all-in sustaining cash cost per gold ounce sold was $1,720 for the quarter ended December 31, 2023, compared to $1,829 in the same period of 2022. The change in the quarter was primarily due to the increased cash cost described above, increased royalties and an administrative penalty in Q4, offset by reduced capital expenditures. For the full year, the all-in sustaining cash cost per gold ounces sold was $1,499 in 2023, compared to $1,529 in 2022. The increased royalties and administrative penalty costs in Q4 2023 were offset by increased production and decreased costs earlier in the year.
Exploration and grade control drilling success in conjunction with underground development extended mineralization on the western side of the Zone 55 mineralized structure. This provided additional mining areas which demonstrated wider and higher-grade extensions of mineralization within and beyond the existing resource boundary.
Séguéla Mine, Côte d'Ivoire
1 Cash cost and All-in sustaining cash cost are non-IFRS financial measures. Refer to Non-IFRS Financial Measures.
2 Capital expenditures are presented on a cash basis
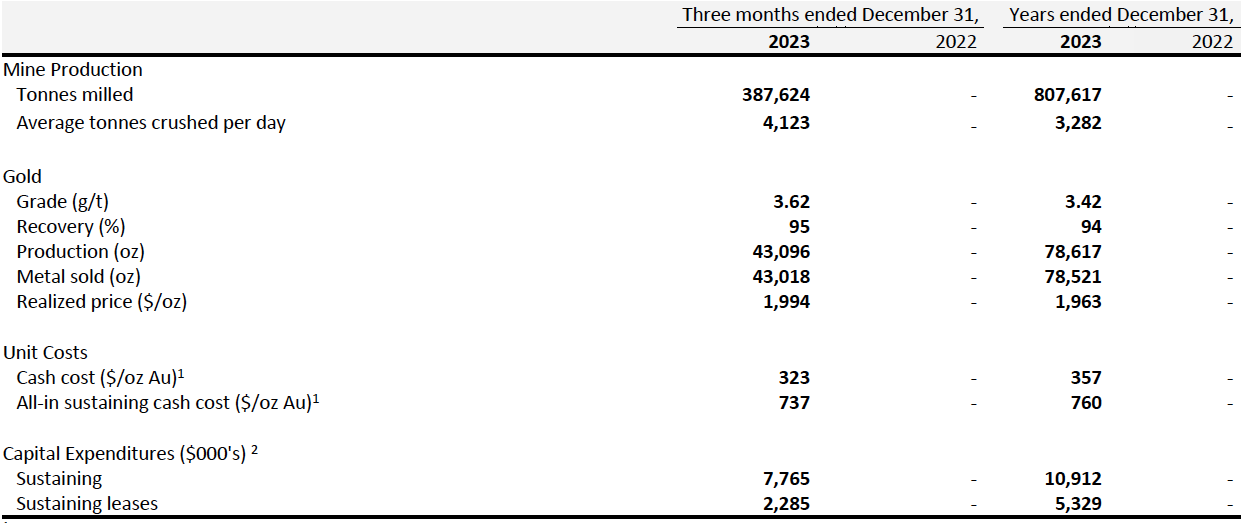
In the fourth quarter of 2023, mined material totaled 387,624 tonnes of ore, averaging 3.62 g/t Au, and containing an estimated 43,096 ounces of gold from the Antenna Pit. Movement of waste during the quarter totaled 2,110,209 tonnes, for a strip ratio of 5.4:1. Séguéla produced 43,096 ounces of gold, a 37% increase and a 5% decrease, respectively, compared to the third quarter of 2023. The increase in gold production is directly related to the mill achieving consistently higher throughput, processing 387,624 tonnes, a 25% increase over the previous quarter.
Gold production in 2023 totaled 78,617 ounces, exceeding the higher end of the annual guidance range.
Reconciliation of tonnes, grade, and gold ounces mined for the fourth quarter from Antenna show a positive correlation when compared to the long-term reserve model with 6% higher ore tonnes mined at 16% higher grades resulting in 24% more gold ounces extracted than predicted in the model.
Process plant performance continued to improve as feed characteristics were stabilized and initial bottlenecks addressed. Recovery in the fourth quarter increased to 94.9%, ahead of feasibility study assumptions. Plant productivity also continued to improve with throughput in the fourth quarter being 186 tonnes/hour, a 20% increase on the 154 tonnes/hour nameplate capacity.
Cash cost per gold ounce sold was $323 for Q4 2023 and $357 for the full year, which was below plan and guidance, primarily due to higher production, higher head grades, lower consumable consumption, and lower service costs.
All-in sustaining cash cost per gold ounce sold was $737 for Q4 2023 and $760 for the full year, which was below plan and guidance, primarily due to lower cash cost and higher sales volume, partially offset by higher capital expenditures.
San Jose Mine, Mexico
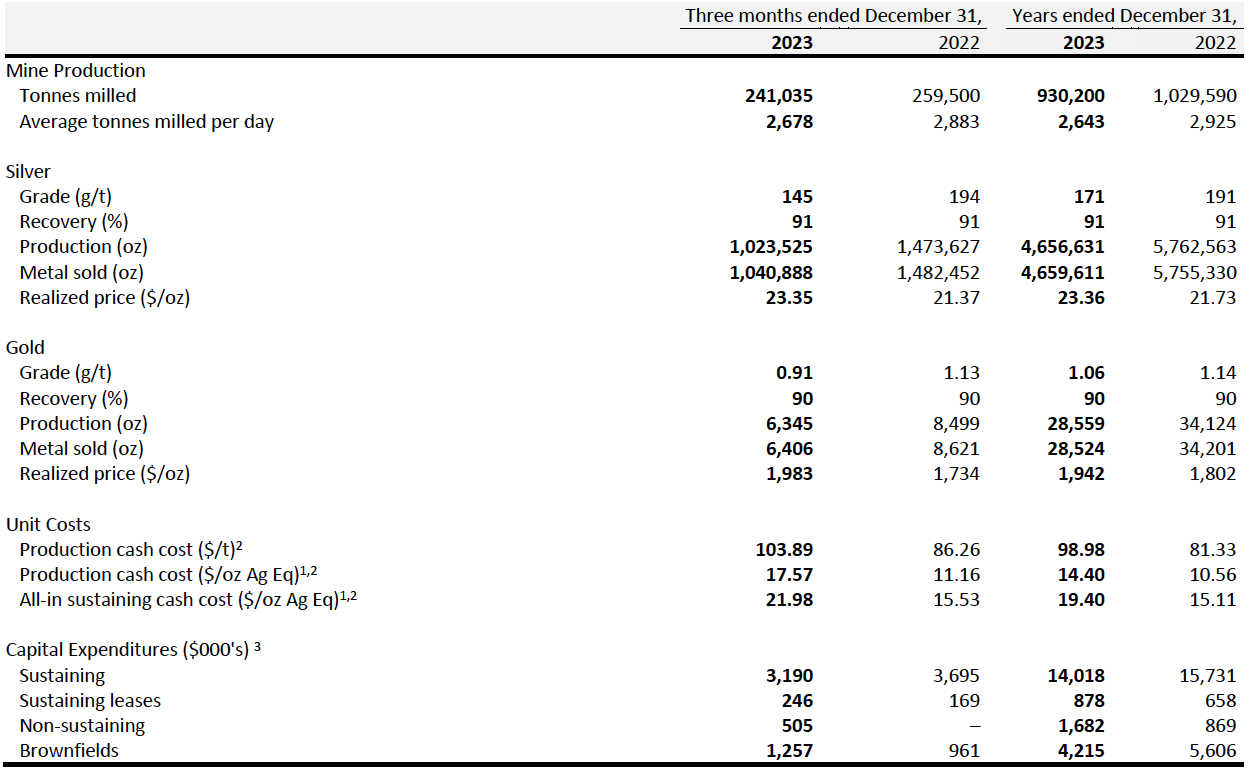
1 Production cash cost silver equivalent and All-in sustaining cash cost silver equivalent are calculated using realized metal prices for each period respectively.
2 Production cash cost, Production cash cost silver equivalent, and All-in sustaining cash cost silver equivalent are Non-IFRS Financial Measures, refer to Non-IFRS Financial Measures section at the end of this news release and to the MD&A accompanying the Company’s financial statements filed on SEDAR+ at www.sedarplus.ca for a description of the calculation of these measures.
3 Capital expenditures are presented on a cash basis.
In the fourth quarter of 2023, San Jose produced 1,023,525 ounces of silver and 6,345 ounces of gold, 31% and 25% decreases respectively, at average head grades for silver and gold of 145 g/t and 0.91 g/t, 25% and 20% decreases respectively, when compared to the same period in 2022. The decrease in silver and gold production for the quarter is explained by the declining grade profile of Mineral Reserves in the mine plan, as well as lower tonnage extracted from the mine. The reduction in tonnage is due to operational challenges leading to delays in backfilling and blasting operations in stopes P and Q during December 2023. During the fourth quarter, the processing plant milled 241,035 tonnes at an average of 2,678 tonnes per day.
Production in 2023 totaled 4,656,631 ounces of silver and 28,559 ounces of gold, 12% and 16% below annual guidance range, respectively. The decrease in production is attributed primarily to the 15-day illegal union blockade in the second quarter, the associated disruption to operations thereafter, and a silver and gold head grade reconciliation to reserves at the lower end of guidance range.
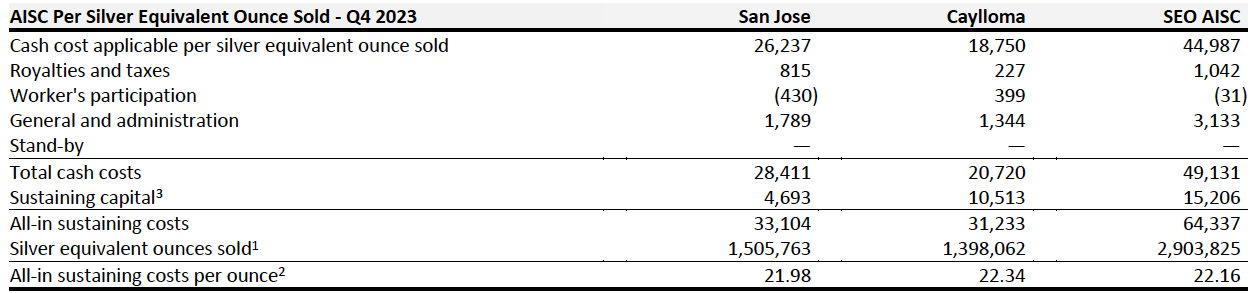
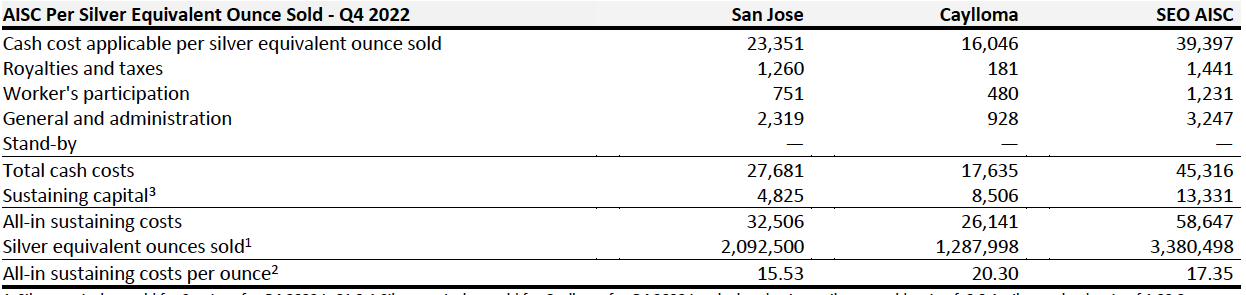
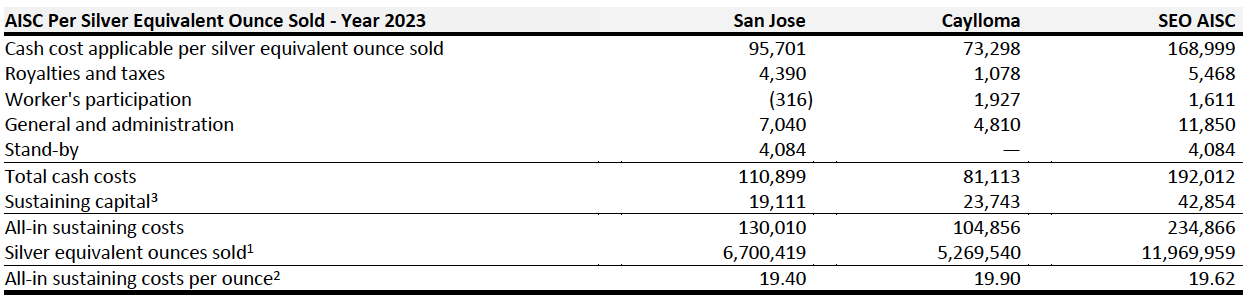
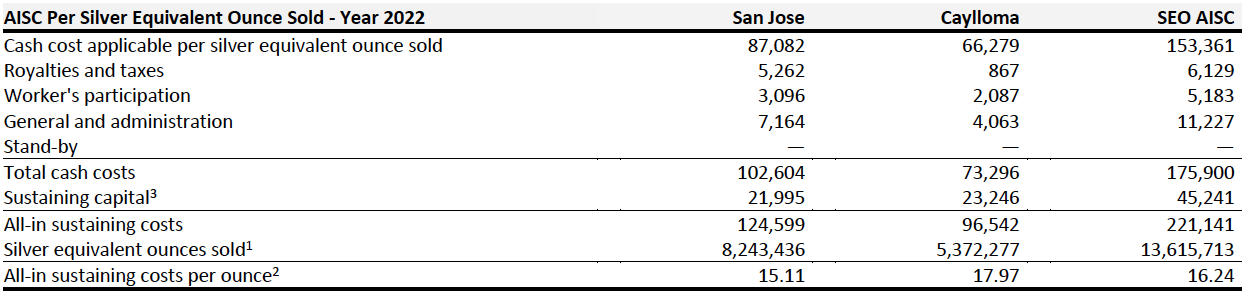
The cash cost per silver equivalent ounce for the three months ending December 31, 2023, was $17.57, an increase from $11.16 in the same period of 2022. This increase was primarily attributed to lower head grades, as discussed above, and higher cash costs per tonne primarily related to the appreciation of the Mexican peso, higher mining contractor tariffs, and a 7% decrease in processed ore. For the year ending December 31, 2023 the cash cost per silver equivalent ounce sold was $14.40 compared to $10.56. The full year increase was driven by lower head grades, and higher cash cost per tonne, which was similarly influenced by the appreciation of the Mexican Peso and 10% lower tonnes processed.
The all-in sustaining cash cost of payable silver equivalent for the three months ended December 31, 2023 increased by 42% to $21.98 per ounce, and full year 2023 increased by 28% to $19.40 per ounce. This compares to $15.53 per ounce and $15.11 per ounce for the same periods in 2022. These increases were mainly driven by higher cash costs and lower production, slightly mitigated by lower workers' participation costs.
The decrease in Brownfields expenditures is primarily attributable to reduced drilling activity in 2023. Drilling in 2023 was however higher than initially anticipated, owing to the emergent drilling campaign at the Yessi vein, discovered in the third quarter of the year. Exploration at the Yessi vein continues.
Caylloma Mine, Peru
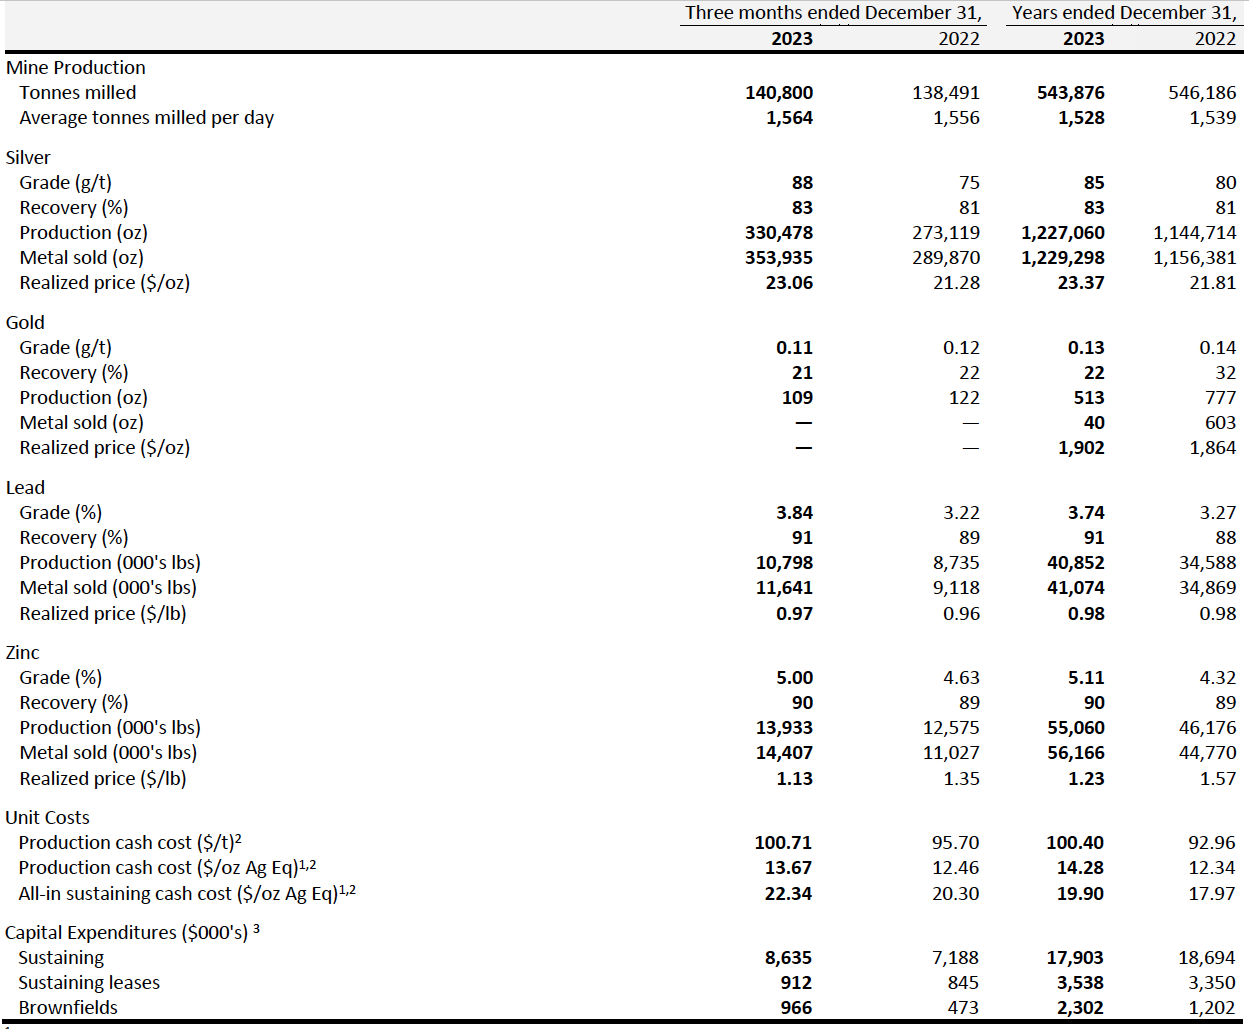
1 Production cash cost silver equivalent and All-in sustaining cash cost silver equivalent are calculated using realized metal prices for each period respectively.
2 Production cash cost, Production cash cost silver equivalent, and All-in sustaining cash cost silver equivalent are Non-IFRS Financial Measures, refer to Non-IFRS Financial Measures section at the end of this news release and to the MD&A accompanying the Company’s financial statements filed on SEDAR+ at www.sedarplus.ca for a description of the calculation of these measures.
3 Capital expenditures are presented on a cash basis.
In the fourth quarter, the Caylloma Mine produced 330,478 ounces of silver at an average head grade of 88 g/t, a 21% and 17% increase, respectively, when compared to the previous quarter. Silver production for 2023 totaled 1,227,060 ounces, exceeding the upper end of annual guidance range by 10%.
Lead and zinc production for the quarter was 10.8 million pounds of lead, and 13.9 million pounds of zinc. Lead and zinc production rose by 24% and 11%, respectively, compared to the same period in 2022. Head grades averaged 3.84%, and 5.00%, a 19% and 8% increase, respectively, when compared to the previous quarter. Record lead and zinc production for 2023 totaled 40.9 and 55.1 million pounds, respectively. Increased production is the result of positive grade reconciliation to the reserve model in levels 16 and 18 of the Animas vein. Gold production for the quarter totaled 109 ounces with an average head grade of 0.11 g/t.
The cash cost per silver equivalent ounce sold for the quarter ended December 31, 2023, was $13.67 compared to $12.46 in the same period in 2022. The increase for the quarter is attributed primarily due to higher cash cost per tonne, higher treatment charges and the impact of higher silver prices on the calculation of silver equivalent ounces. For the year ended December 31, 2023, the cash cost per ounce of gold sold was $14.3, compared to $12.3 in 2022. The full year increase was driven mainly by the same factors explained above for the quarter.
The all-in sustaining cash cost per ounce of payable silver equivalent for the three months ended December 31, 2023, increased 10% to $22.34, compared to $20.30 for the same period in 2022. The all-in sustaining cash cost per ounce of payable silver equivalent for the full year 2023 increased 11% to $19.90, compared to $17.97 in 2022. The increases were mainly driven by the impact of higher silver prices on the calculation of silver equivalent ounces, higher cash costs per ounce and higher capital costs.
Underground development for the quarter was mainly focused on mine levels 15, 16, and 18. The increase in Brownfields expenditures is primarily attributable to greater meterage and additional diamond drilling.
Qualified Person
Eric Chapman, Senior Vice President of Technical Services, is a Professional Geoscientist of the Association of Professional Engineers and Geoscientists of the Province of British Columbia (Registration Number 36328), and is the Company’s Qualified Person (as defined by National Instrument 43-101). Mr. Chapman has reviewed and approved the scientific and technical information contained in this news release and has verified the underlying data.
Fourth Quarter Unaudited and Annual Audited Income Statement and Cash Flow
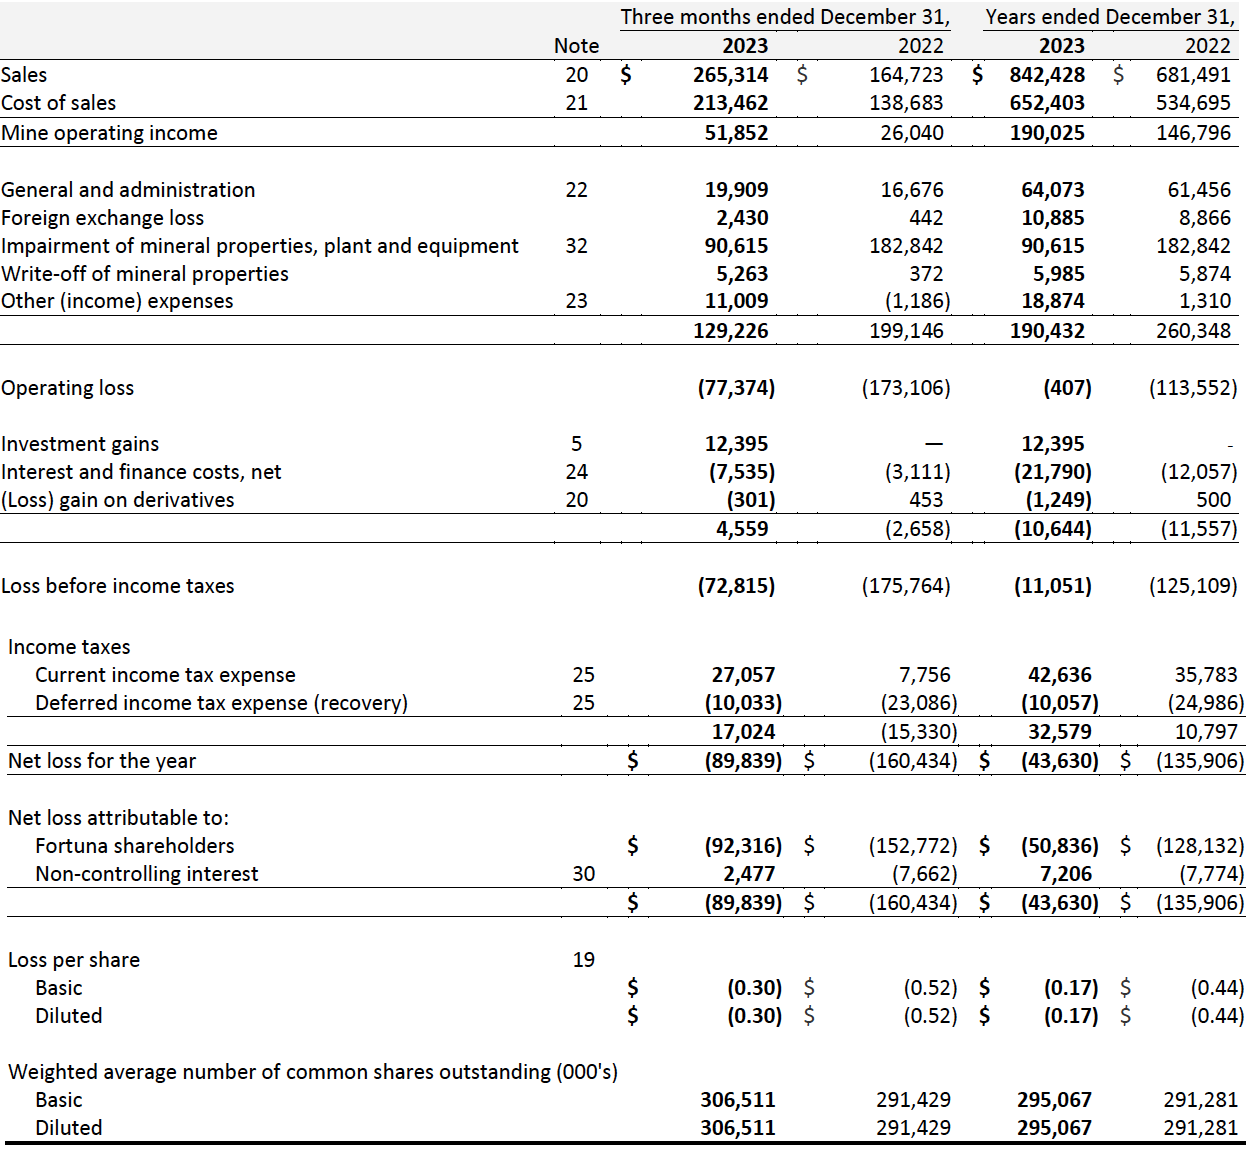
Income Statement
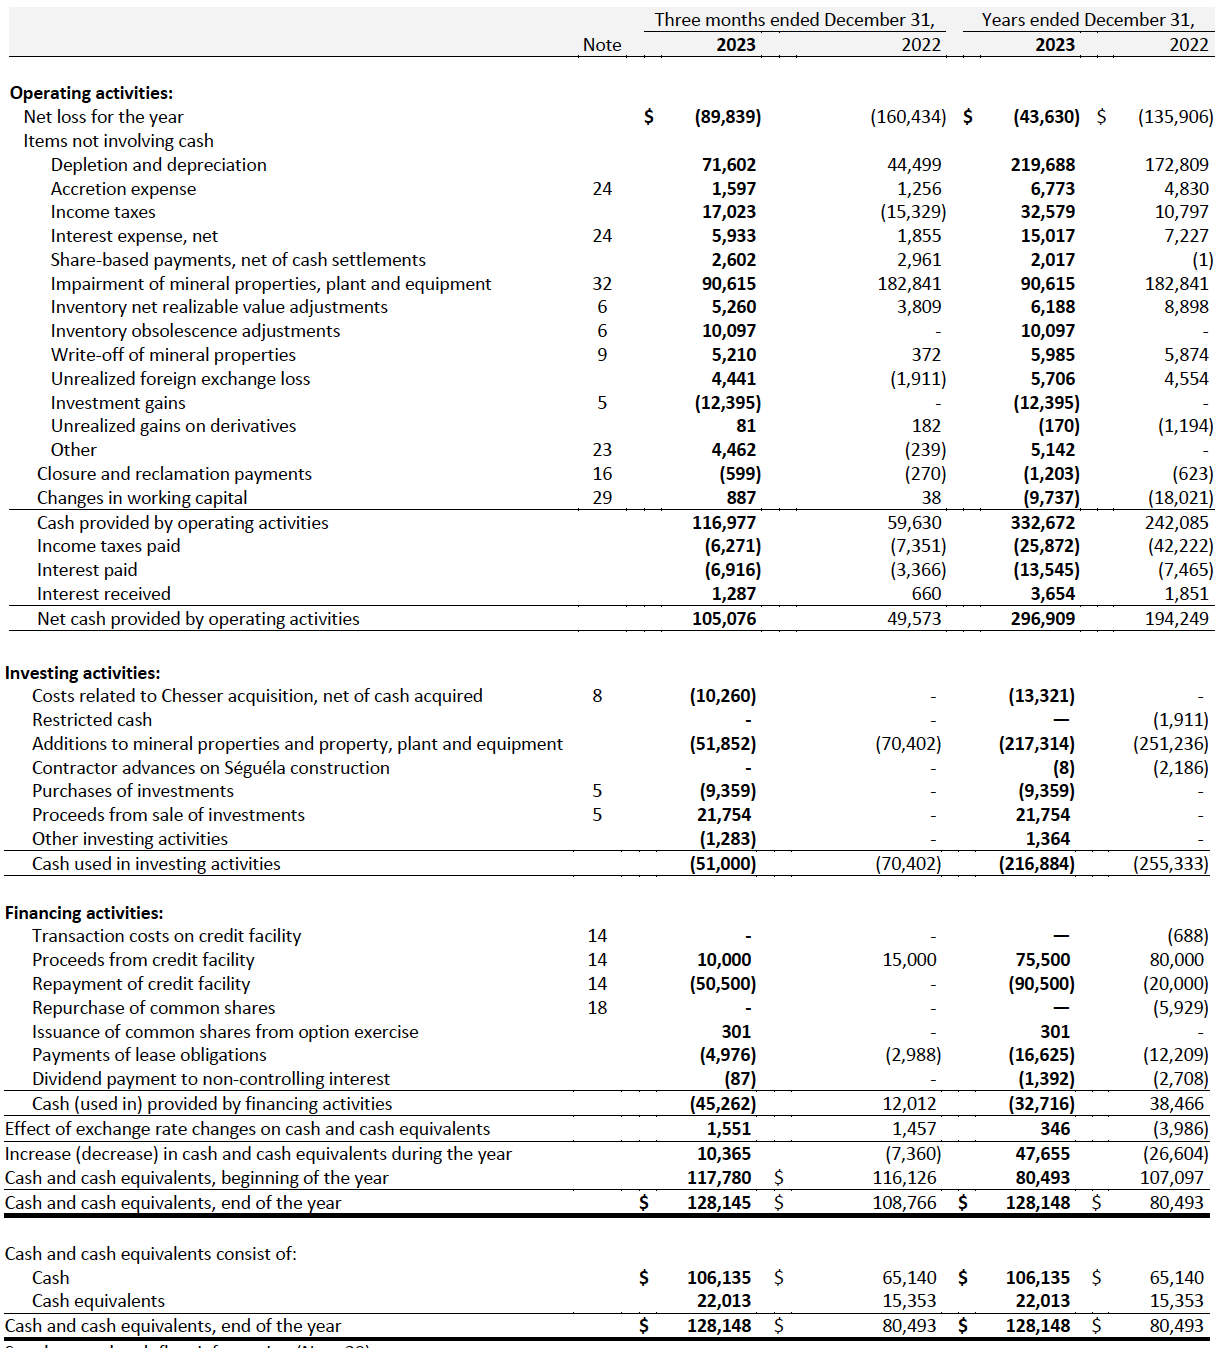
Statement of Cash Flow
Non-IFRS Financial Measures
The Company has disclosed certain financial measures and ratios in this news release which are not defined under the International Financial Reporting Standards (“IFRS”), as issued by the International Accounting Standards Board, and are not disclosed in the Company's financial statements, including but not limited to: cash cost per ounce of gold equivalent sold; all-in sustaining cash cost per ounce of gold equivalent sold; all-in cash cost per ounce of gold equivalent sold; total production cash cost per tonne; cash cost per payable ounce of silver equivalent sold; all-in sustaining cash cost per payable ounce of silver equivalent sold; all-in cash cost per payable ounce of silver equivalent sold; free cash flow from ongoing operations; adjusted net income; attributable adjusted net income; adjusted EBITDA; net debt and working capital.
These non-IFRS financial measures and non-IFRS ratios are widely reported in the mining industry as benchmarks for performance and are used by management to monitor and evaluate the Company's operating performance and ability to generate cash. The Company believes that, in addition to financial measures and ratios prepared in accordance with IFRS, certain investors use these non-IFRS financial measures and ratios to evaluate the Company’s performance. However, the measures do not have a standardized meaning under IFRS and may not be comparable to similar financial measures disclosed by other companies. Accordingly, non-IFRS financial measures and non-IFRS ratios should not be considered in isolation or as a substitute for measures and ratios of the Company’s performance prepared in accordance with IFRS. The Company has calculated these measures consistently for all periods presented.
To facilitate a better understanding of these measures and ratios as calculated by the Company, descriptions are provided below. In addition, see “Non-IFRS Financial Measures” in the Company’s management’s discussion and analysis for the fiscal year ended December 31, 2023 (“2023 MD&A”), which section is incorporated by reference in this news release, for additional information regarding each non-IFRS financial measure and non-IFRS ratio disclosed in this news release, including an explanation of their composition; an explanation of how such measures and ratios provide useful information to an investor and the additional purposes, if any, for which management of Fortuna uses such measures and ratio. The 2023 MD&A may be accessed on SEDAR+ at www.sedarplus.ca under the Company’s profile, Fortuna Silver Mines Inc.
Except as otherwise described in the 2023 MD&A, the Company has calculated these measures consistently for all periods presented.
Reconciliation to Adjusted Net Income for the Three and Twelve Months ended December 31, 2023 and 2022
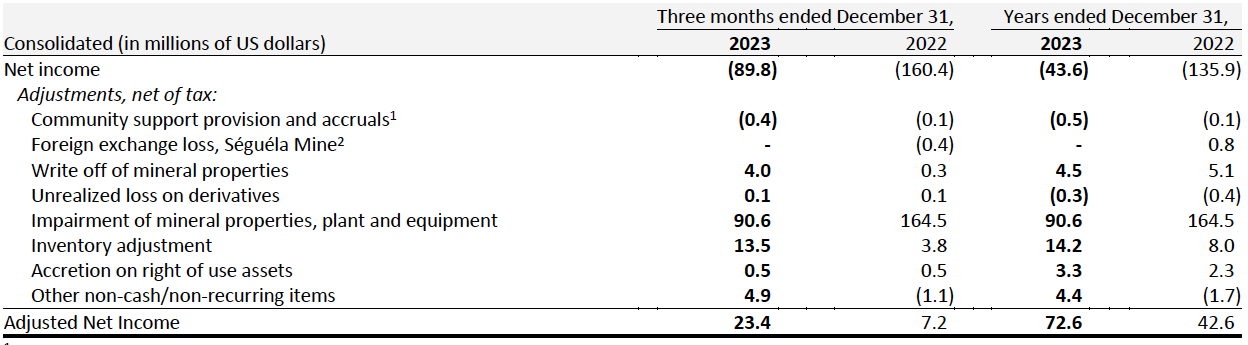
1 Amounts are recorded in Cost of sales
2 Amounts are recorded in General and Administration
Figures may not add due to rounding
Reconciliation to Attributable Adjusted Net Income for the Three and Twelve Months ended December 31, 2023 and 2022
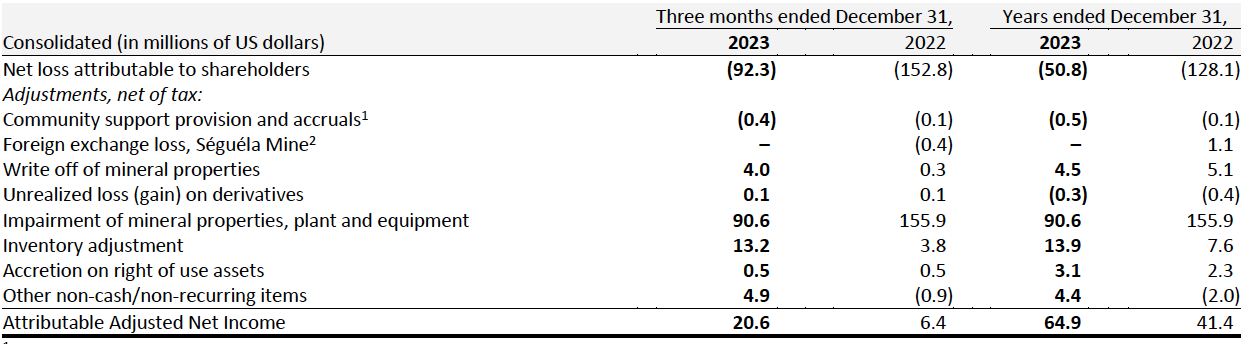
1 Amounts are recorded in Cost of sales
2 Amounts are recorded in General and Administration
Figures may not add due to rounding
Reconciliation to Adjusted EBITDA for the Three and Twelve Months ended December 31, 2023 and 2022
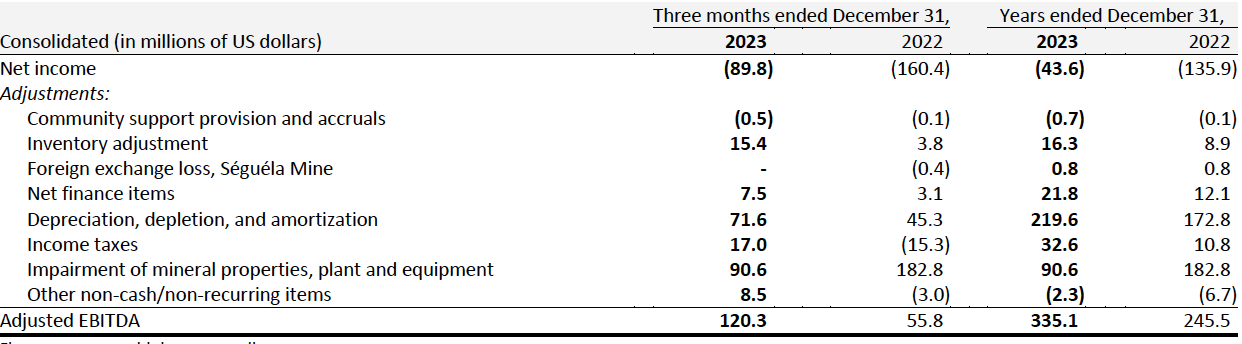
Figures may not add due to rounding
Reconciliation of Free Cash Flow from ongoing operations for the Three and Twelve Months ended December 31, 2023 and 2022
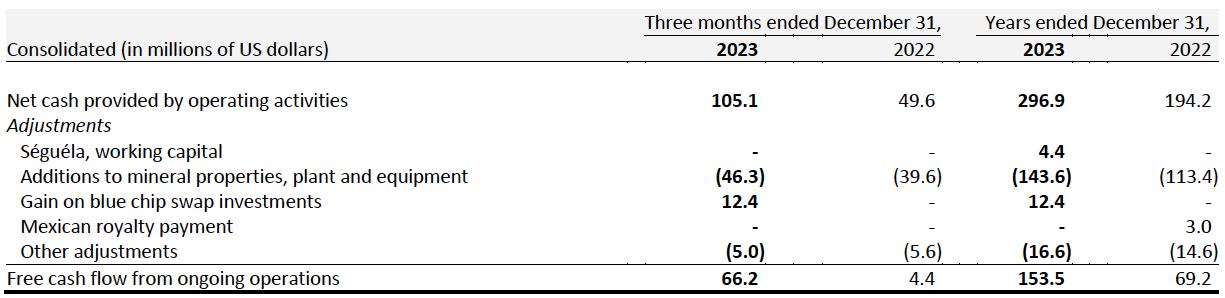
Figures may not add due to rounding
Reconciliation of Cash Cost per Gold Equivalent Ounce Sold for the Three and Twelve Months ended December 31, 2023 and 2022
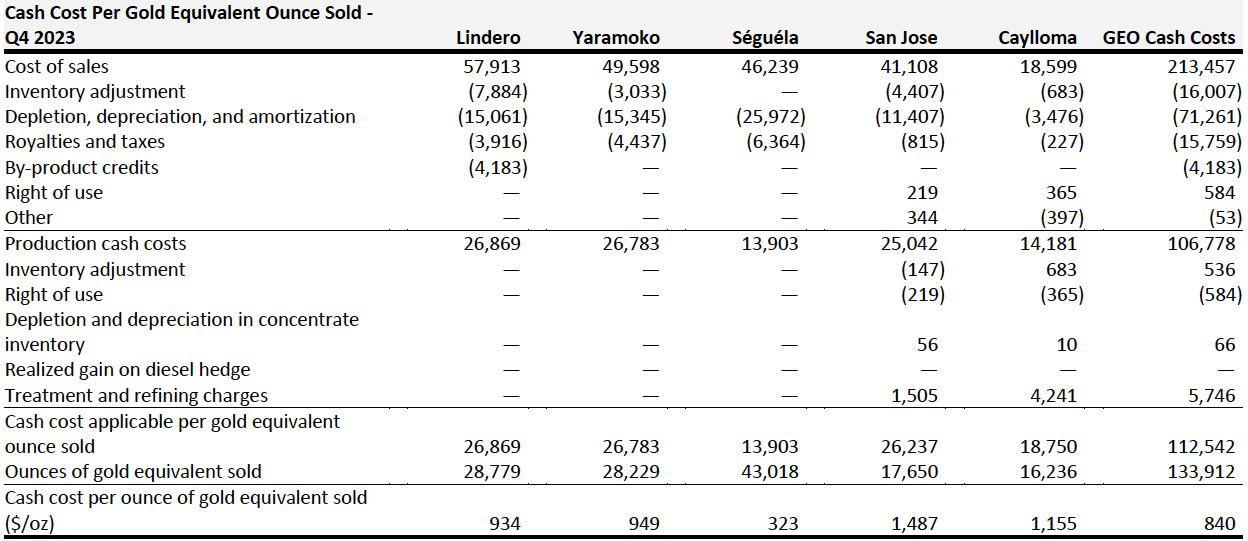
Gold equivalent was calculated using the realized prices for gold of $1,990/oz Au, $23.3/oz Ag, $2,137/t Pb, and $2,499/t Zn for Q4 2023.
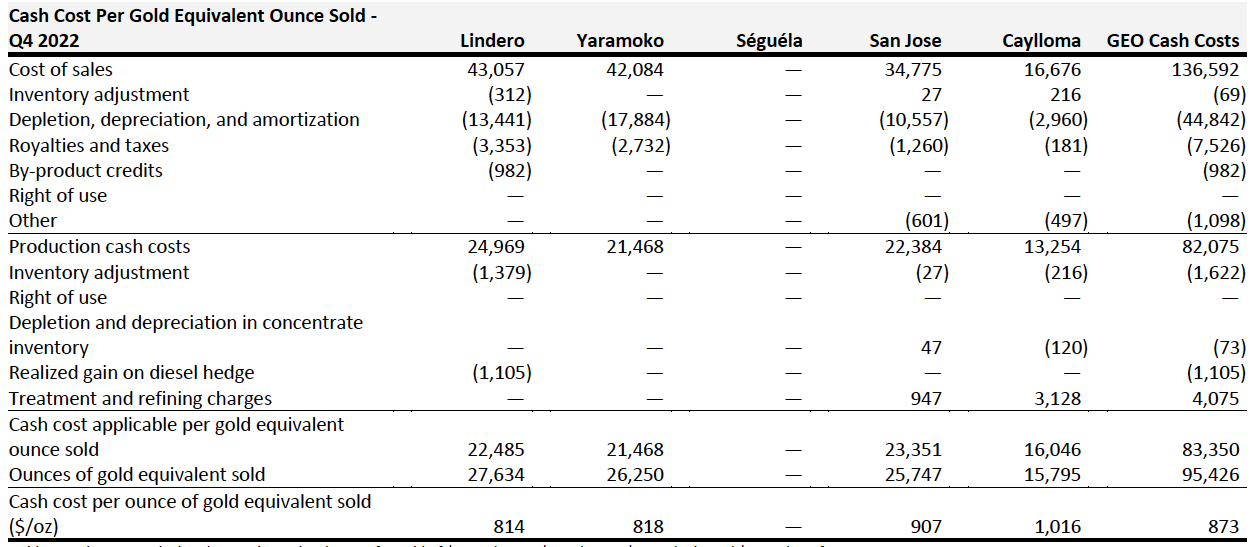
Gold equivalent was calculated using the realized prices for gold of $1,737/oz Au, $21.4/oz Ag, $2,106/t Pb, and $2,986/t Zn for Q4 2022.
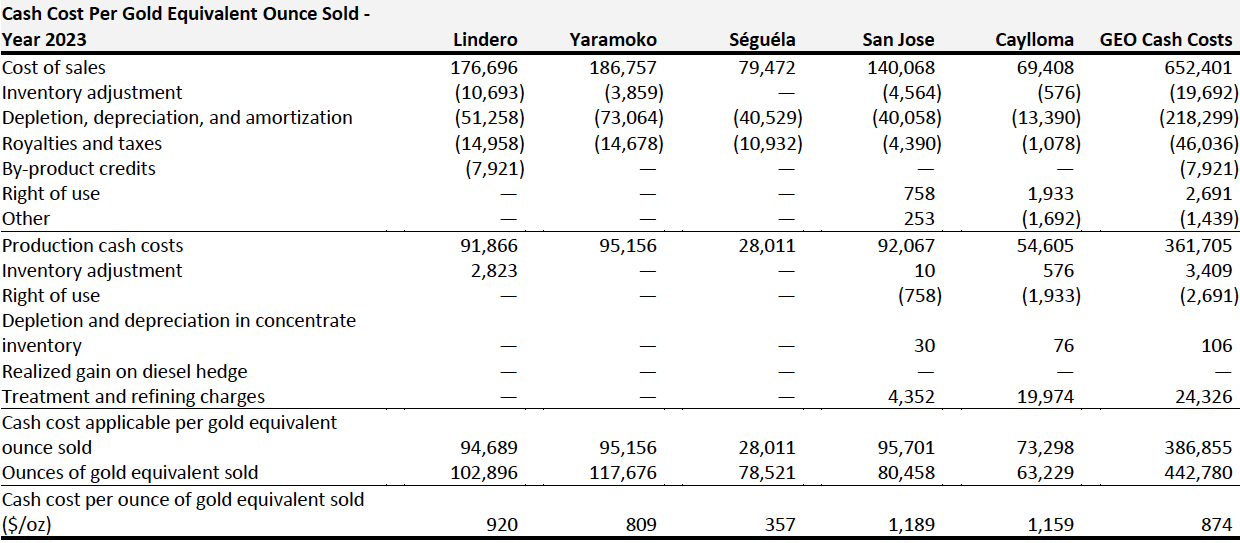
Gold equivalent was calculated using the realized prices for gold of $1,948/oz Au, $23.4/oz Ag, $2,155/t Pb, and $2,706/t Zn for year 2023.
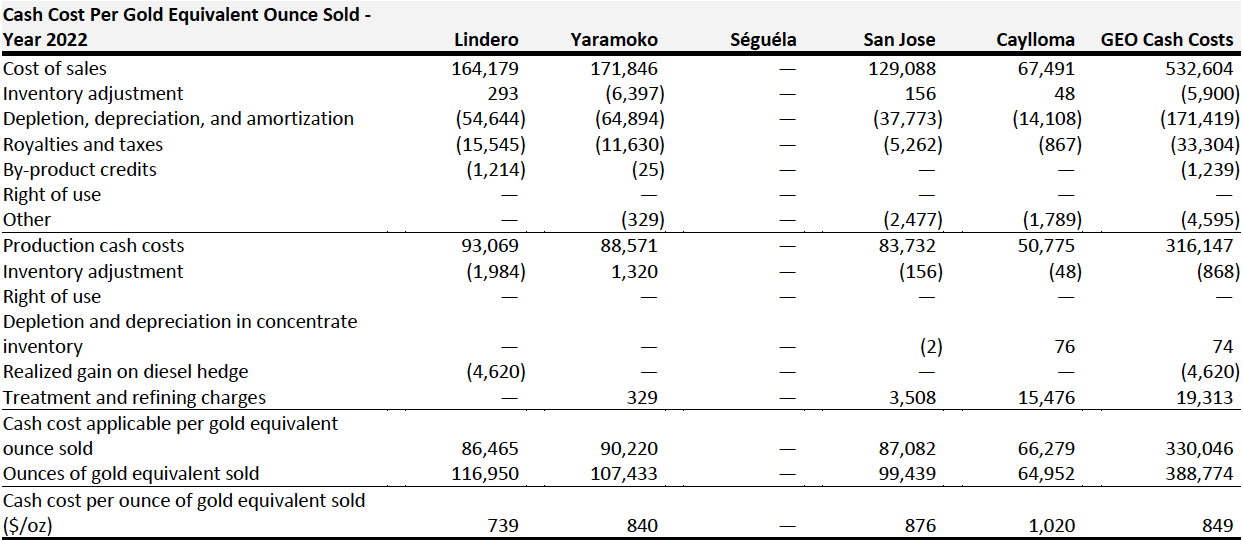
Gold equivalent was calculated using the realized prices for gold of $1,802/oz Au, $21.8/oz Ag, $2,161/t Pb, and $3,468/t Zn for year 2022.
Reconciliation of All-in Sustaining Cash Cost per Ounce of Gold Equivalent Sold for the Three and Twelve Months ended December 31, 2023 and 2023
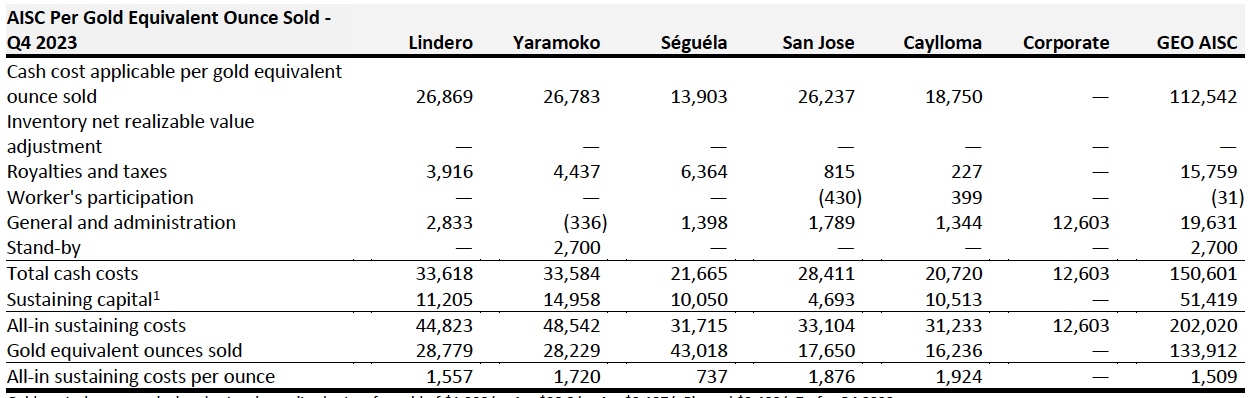
Gold equivalent was calculated using the realized prices for gold of $1,990/oz Au, $23.3/oz Ag, $2,137/t Pb, and $2,499/t Zn for Q4 2023.
1 Presented on a cash basis
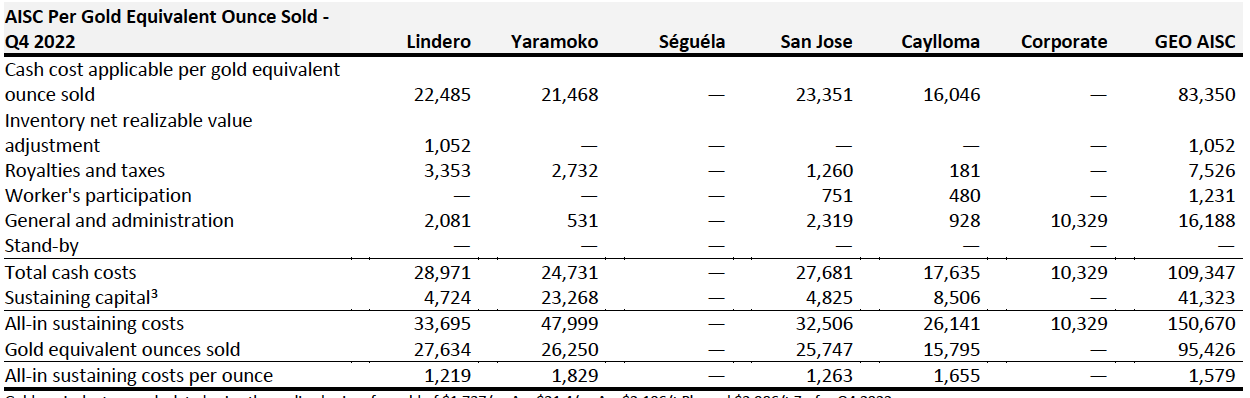
Gold equivalent was calculated using the realized prices for gold of $1,737/oz Au, $21.4/oz Ag, $2,106/t Pb, and $2,986/t Zn for Q4 2022.
1 Presented on a cash basis
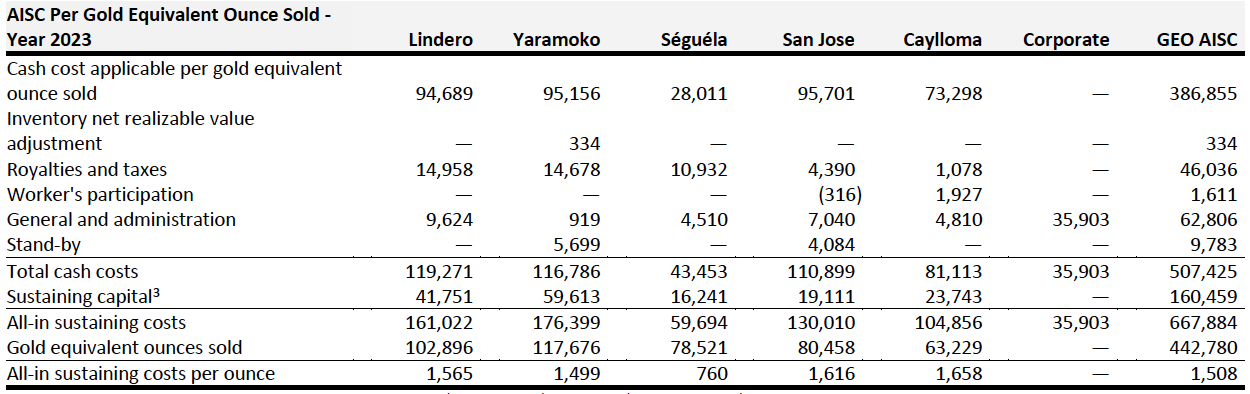
Gold equivalent was calculated using the realized prices for gold of $1,948/oz Au, $23.4/oz Ag, $2,155/t Pb, and $2,706/t Zn for year 2023.
1 Presented on a cash basis
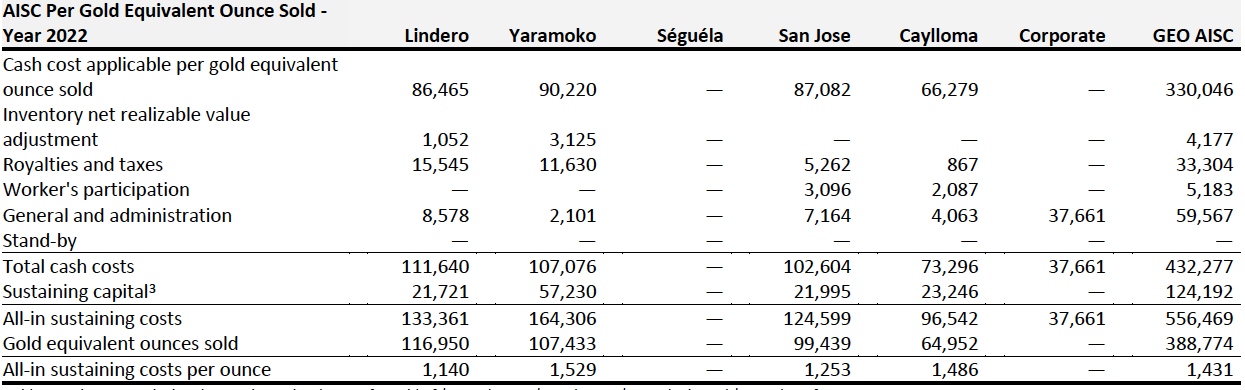
Gold equivalent was calculated using the realized prices for gold of $1,802/oz Au, $21.8/oz Ag, $2,161/t Pb, and $3,468/t Zn for year 2022.
1 Presented on a cash basis
Reconciliation of Production Cash Cost per Tonne and Cash Cost per Payable Silver Equivalent Ounce Sold for the Three and Twelve Months ended December 31, 2023 and 2022
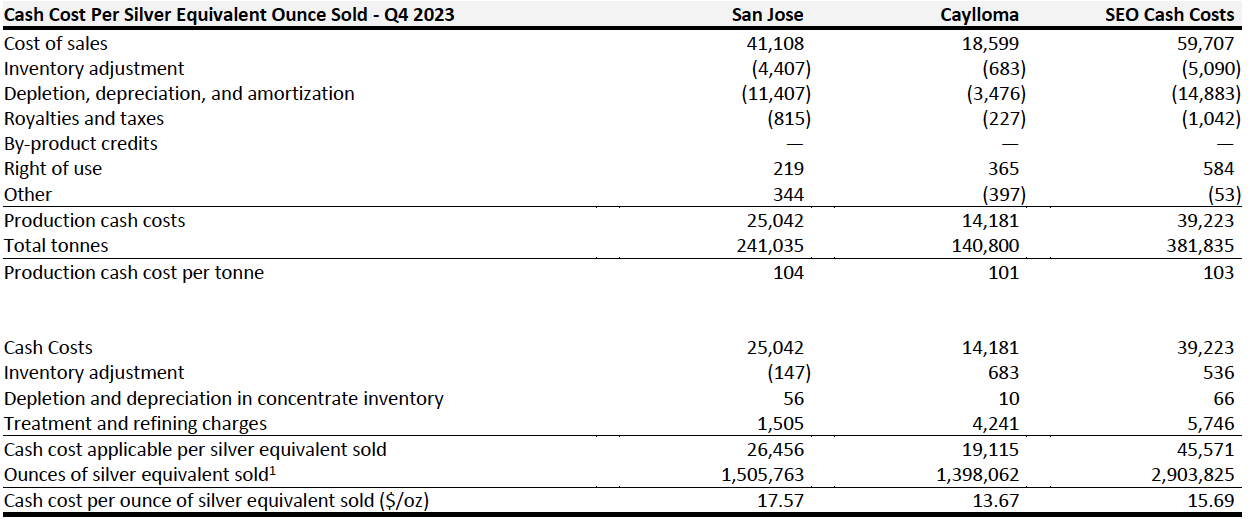
1 Silver equivalent sold for Q4 2023 for San Jose is calculated using a silver to gold ratio of 84.9:1. Silver equivalent sold for Q4 2023 for Caylloma is calculated using a silver to gold ratio of 0.0:1, silver to lead ratio of 1:23.8 pounds, and silver to zinc ratio of 1:20.3 pounds.
2 Silver equivalent is calculated using the realized prices for gold, silver, lead, and zinc. Refer to Financial Results - Sales and Realized Prices
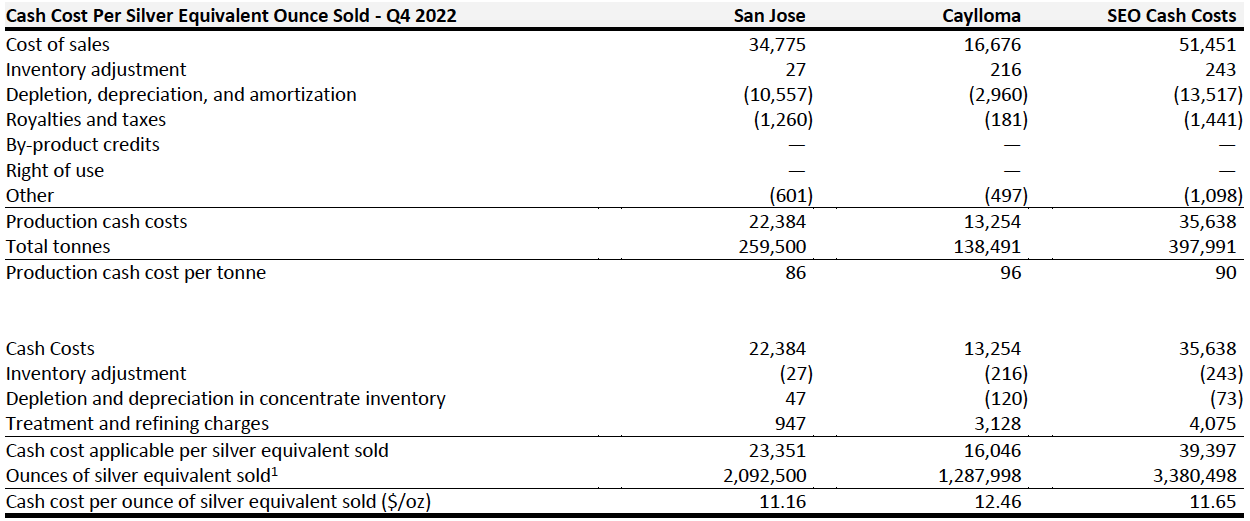
1 Silver equivalent sold for San Jose for Q4 2022 is 81.2:1.Silver equivalent sold for Caylloma for Q4 2022 is calculated using a silver to gold ratio of 0.0:1, silver to lead ratio of 1:22.3 pounds, and silver to zinc ratio 1:15.7.
2 Silver equivalent is calculated using the realized prices for gold, silver, lead, and zinc. Refer to Financial Results - Sales and Realized Prices
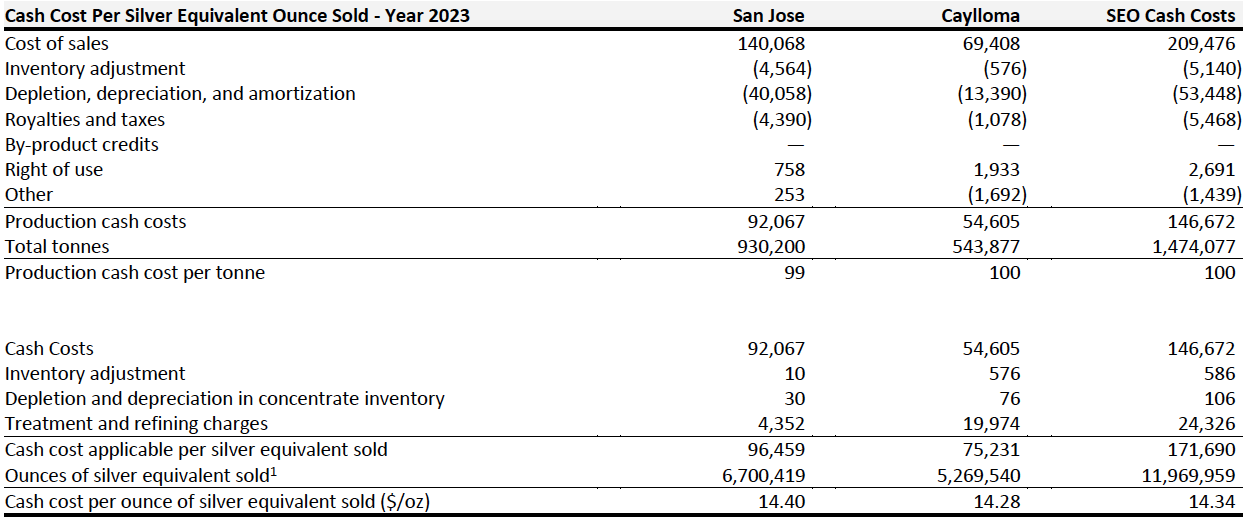
1 Silver equivalent sold for year 2023 for San Jose is calculated using a silver to gold ratio of 83.1:1. Silver equivalent sold for year 2023 for Caylloma is calculated using a silver to gold ratio of 81.4:1, silver to lead ratio of 1:23.9 pounds, and silver to zinc ratio of 1:19.0 pounds.
2 Silver equivalent is calculated using the realized prices for gold, silver, lead, and zinc. Refer to Financial Results - Sales and Realized Prices
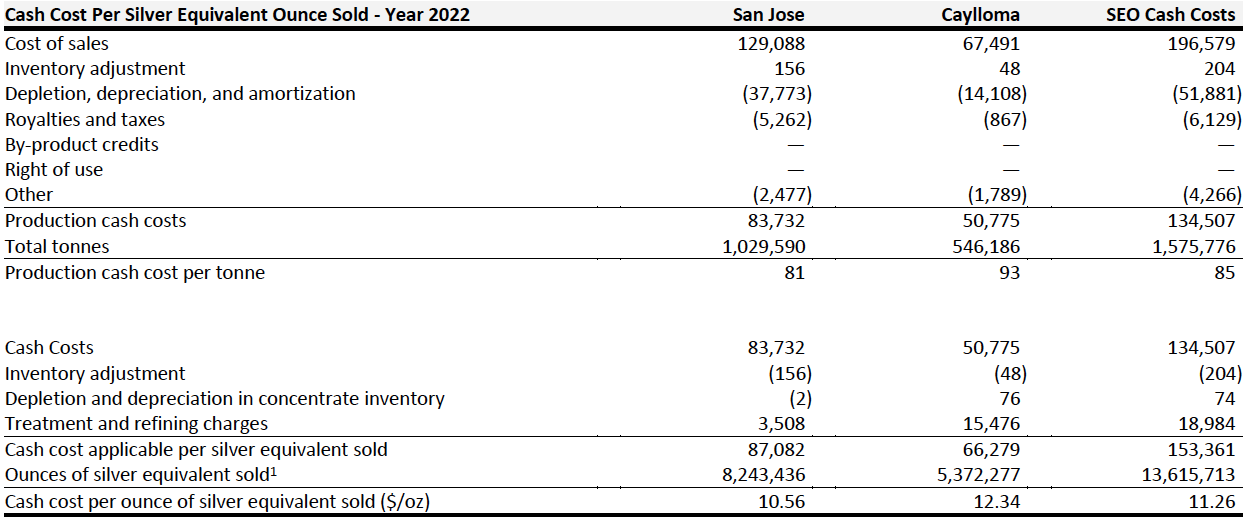
1 Silver equivalent sold for year 2022 for San Jose is calculated using a silver to gold ratio of 82.9:1. Silver equivalent sold for year 2022 for Caylloma is calculated using a silver to gold ratio of 85.5:1, silver to lead ratio of 1:22.9 pounds, and silver to zinc ratio of 1:13.9 pounds.
2 Silver equivalent is calculated using the realized prices for gold, silver, lead, and zinc. Refer to Financial Results - Sales and Realized Prices
Reconciliation of All-in Sustaining Cash Cost and All-in Cash Cost per Payable Silver Equivalent Ounce Sold for the Three and Twelve Months ended December 31, 2023 and 2022
1 Silver equivalent sold for Q4 2023 for San Jose is calculated using a silver to gold ratio of 84.9:1. Silver equivalent sold for Q4 2023 for Caylloma is calculated using a silver to gold ratio of 0.0:1, silver to lead ratio of 1:23.8 pounds, and silver to zinc ratio of 1:20.3 pounds.
2 Silver equivalent is calculated using the realized prices for gold, silver, lead, and zinc. Refer to Financial Results - Sales and Realized Prices
3 Presented on a cash basis
1 Silver equivalent sold for San Jose for Q4 2022 is 81.2:1.Silver equivalent sold for Caylloma for Q4 2022 is calculated using a silver to gold ratio of 0.0:1, silver to lead ratio of 1:22.3 pounds, and silver to zinc ratio 1:15.7.
2 Silver equivalent is calculated using the realized prices for gold, silver, lead, and zinc. Refer to Financial Results - Sales and Realized Prices
3 Presented on a cash basis
1 Silver equivalent sold for year 2023 for San Jose is calculated using a silver to gold ratio of 83.1:1. Silver equivalent sold for year 2023 for Caylloma is calculated using a silver to gold ratio of 81.4:1, silver to lead ratio of 1:23.9 pounds, and silver to zinc ratio of 1:19.0 pounds.
2 Silver equivalent is calculated using the realized prices for gold, silver, lead, and zinc. Refer to Financial Results - Sales and Realized Prices
3 Presented on a cash basis
1 Silver equivalent sold for year 2022 for San Jose is calculated using a silver to gold ratio of 82.9:1. Silver equivalent sold for year 2022 for Caylloma is calculated using a silver to gold ratio of 85.5:1, silver to lead ratio of 1:22.9 pounds, and silver to zinc ratio of 1:13.9 pounds.
2 Silver equivalent is calculated using the realized prices for gold, silver, lead, and zinc. Refer to Financial Results - Sales and Realized Prices
3 Presented on a cash basis
Additional information regarding the Company’s financial results and activities underway are available in the Company’s audited consolidated financial statements for the year ended December 31, 2023 and accompanying 2023 MD&A, which are available for download on the Company’s website, www.fortunasilver.com, on SEDAR+ at www.sedarplus.ca and on EDGAR at www.sec.gov/edgar.
Conference Call and Webcast
A conference call to discuss the financial and operational results will be held on Thursday, March 7, 2024 at 9:00 a.m. Pacific time | 12:00 p.m. Eastern time. Hosting the call will be Jorge A. Ganoza, President and CEO; Luis D. Ganoza, Chief Financial Officer; Cesar Velasco, Chief Operating Officer - Latin America; and David Whittle, Chief Operating Officer - West Africa.
Shareholders, analysts, media and interested investors are invited to listen to the live conference call by logging onto the webcast at https://www.webcaster4.com/Webcast/Page/1696/49929 or over the phone by dialing in just prior to the starting time.
Conference call details:
Date: Thursday, March 7, 2024
Time: 9:00 a.m. Pacific time | 12:00 p.m. Eastern time
Dial in number (Toll Free): +1. 888.506.0062
Dial in number (International): +1.973.528.0011
Entry code: 866537
Replay number (Toll Free): +1.877.481.4010
Replay number (International): +1.919.882.2331
Replay Passcode: 49929
Playback of the earnings call will be available until Thursday, March 21, 2024. Playback of the webcast will be available until Thursday, March 6, 2025. In addition, a transcript of the call will be archived on the Company’s website.
About Fortuna Silver Mines Inc.
Fortuna Silver Mines Inc. is a Canadian precious metals mining company with five operating mines in Argentina, Burkina Faso, Côte d'Ivoire, Mexico, and Peru. Sustainability is integral to all our operations and relationships. We produce gold and silver and generate shared value over the long-term for our stakeholders through efficient production, environmental protection, and social responsibility. For more information, please visit our website.
ON BEHALF OF THE BOARD
Jorge A. Ganoza
President, CEO, and Director
Fortuna Silver Mines Inc.
Investor Relations:
Carlos Baca | moc.revlisanutrof@ofni | www.fortunasilver.com | Twitter | LinkedIn | YouTube
Forward-looking Statements
This news release contains forward-looking statements which constitute "forward-looking information" within the meaning of applicable Canadian securities legislation and "forward-looking statements" within the meaning of the "safe harbor" provisions of the Private Securities Litigation Reform Act of 1995 (collectively, "Forward-looking Statements"). All statements included herein, other than statements of historical fact, are Forward-looking Statements and are subject to a variety of known and unknown risks and uncertainties which could cause actual events or results to differ materially from those reflected in the Forward-looking Statements. The Forward-looking Statements in this news release include, without limitation, statements about the Company's plans for its mines and mineral properties; the Company’s anticipated financial and operational performance in 2024; estimated production and costs of production for 2024, including grade and volume of metal produced and sales, revenues and cashflows, and capital costs (sustaining and non-sustaining), and operating costs, including projected production cash costs and all-in sustaining costs; the ability of the Company to mitigate the inflationary pressures on supplies used in its operations; estimated capital expenditures and estimated exploration spending in 2024, including amounts for exploration activities at its properties; statements regarding the Company's liquidity, access to capital; the impact of high inflation on the costs of production and the supply chain; the Company’s expectation that the leach pad expansion project at Lindero will be completed during the second half of 2024; statements that a Preliminary Economic Assessment in respect of the Diamba Sud project will be prepared by the end of 2024, subject to the results of the results of the Company’s drill program; statements relating to the anticipated closure of the San Jose Mine and the possibility of extending production beyond 2024; statements that the Diamba Sud project and the Séguéla Mine are priorities for exploration programs in 2024; statements that management has identified opportunities in 2024 to further optimize and debottleneck the processing facility at the Séguéla Mine; the Company's business strategy, plans and outlook, including statements that the Company has guided further growth in 2024 and anticipates further debt reduction; the merit of the Company's mines and mineral properties; mineral resource and reserve estimates, metal recovery rates, concentrate grade and quality; changes in tax rates and tax laws, requirements for permits, anticipated approvals and other matters. Often, but not always, these Forward-looking Statements can be identified by the use of words such as "estimated", “expected”, “anticipated”, "potential", "open", "future", "assumed", "projected", "used", "detailed", "has been", "gain", "planned", "reflecting", "will", "containing", "remaining", "to be", or statements that events, "could" or "should" occur or be achieved and similar expressions, including negative variations.
Forward-looking Statements involve known and unknown risks, uncertainties and other factors which may cause the actual results, performance or achievements of the Company to be materially different from any results, performance or achievements expressed or implied by the Forward-looking Statements. Such uncertainties and factors include, among others, changes in general economic conditions and financial markets; uncertainty relating to new mining operations such as the Séguéla Mine; risks associated with war or other geo-political hostilities, such as the Ukrainian – Russian conflict, any of which could continue to cause a disruption in global economic activity; fluctuation in currencies and foreign exchange rates; increases in the rate of inflation; the imposition or any extension of capital controls in countries in which the Company operates; any changes in tax laws in Argentina and the other countries in which we operate; changes in the prices of key supplies; technological and operational hazards in Fortuna’s mining and mine development activities; risks inherent in mineral exploration; uncertainties inherent in the estimation of mineral reserves, mineral resources, and metal recoveries; changes to current estimates of mineral reserves and resources; changes to production and cost estimates; that the appeal filed in the Mexican Collegiate Court challenging the reinstatement of the environmental impact authorization at the San Jose Mine (the “EIA”) will be successful; changes in the position of regulatory authorities with respect to the granting of approvals or permits; governmental and other approvals; changes in government, political unrest or instability in countries where Fortuna is active; labor relations issues; as well as those factors discussed under “Risk Factors” in the Company's Annual Information Form.
Although the Company has attempted to identify important factors that could cause actual actions, events or results to differ materially from those described in Forward-looking Statements, there may be other factors that cause actions, events or results to differ from those anticipated, estimated or intended. Forward-looking Statements contained herein are based on the assumptions, beliefs, expectations and opinions of management, including but not limited to the accuracy of the Company’s current mineral resource and reserve estimates; that the Company’s activities will be conducted in accordance with the Company’s public statements and stated goals; that there will be no material adverse change affecting the Company, its properties or changes to production estimates (which assume accuracy of projected ore grade, mining rates, recovery timing, and recovery rate estimates and may be impacted by unscheduled maintenance, labor and contractor availability and other operating or technical difficulties); geopolitical uncertainties that may affect the Company’s production, workforce, business, operations and financial condition; the expected trends in mineral prices and currency exchange rates; that the Company will be successful in mitigating the impact of inflation on its business and operations; that the appeal in respect of the ruling in favor of Minera Cuzcatlan reinstating the EIA will not be successful; that all required approvals and permits will be obtained for the Company’s business and operations on acceptable terms; that there will be no significant disruptions affecting the Company's operations, the ability to meet current and future obligations and such other assumptions as set out herein. Forward-looking Statements are made as of the date hereof and the Company disclaims any obligation to update any Forward-looking Statements, whether as a result of new information, future events or results or otherwise, except as required by law. There can be no assurance that these Forward-looking Statements will prove to be accurate, as actual results and future events could differ materially from those anticipated in such statements. Accordingly, investors should not place undue reliance on Forward-looking Statements.
Cautionary Note to United States Investors Concerning Estimates of Reserves and Resources
Reserve and resource estimates included in this news release have been prepared in accordance with National Instrument 43-101 Standards of Disclosure for Mineral Projects ("NI 43-101") and the Canadian Institute of Mining, Metallurgy, and Petroleum Definition Standards on Mineral Resources and Mineral Reserves. NI 43-101 is a rule developed by the Canadian Securities Administrators that establishes standards for public disclosure by a Canadian company of scientific and technical information concerning mineral projects. Unless otherwise indicated, all mineral reserve and mineral resource estimates contained in the technical disclosure have been prepared in accordance with NI 43-101 and the Canadian Institute of Mining, Metallurgy and Petroleum Definition Standards on Mineral Resources and Reserves. Canadian standards, including NI 43-101, differ significantly from the requirements of the Securities and Exchange Commission, and mineral reserve and resource information included in this news release may not be comparable to similar information disclosed by U.S. companies.